4PH1
Changes of State
Solids, Liquids & Gases · 2 question types
Aim
- Measure how the temperature of a sample changes with time as it is heated steadily, and identify the flat region on the temperature-vs-time graph where the sample is changing state
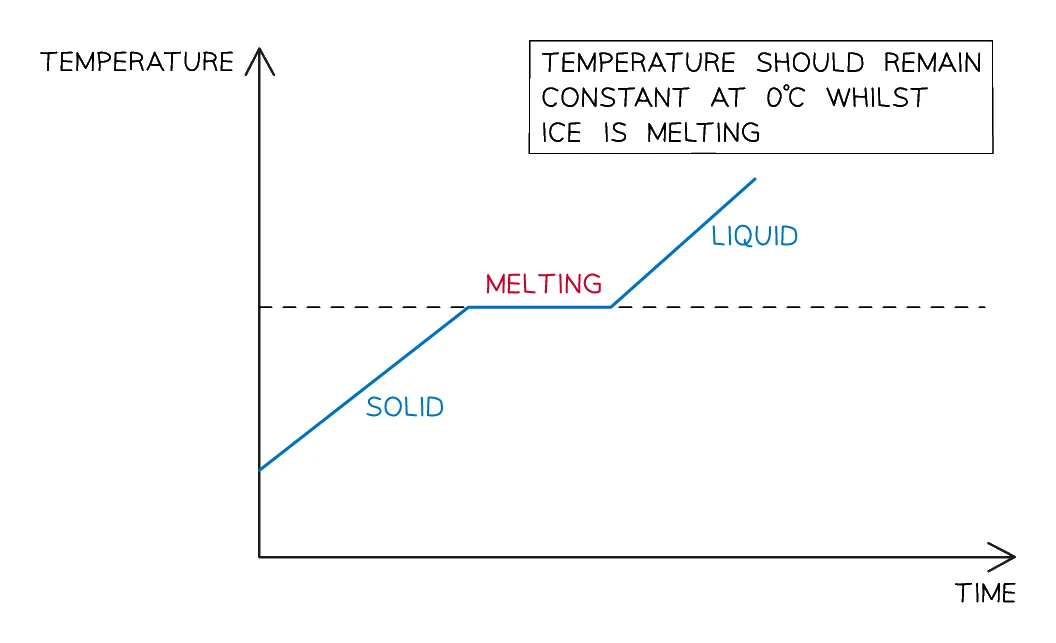
- For ice this is the period when the ice and water sit together at 0 °C while the rest of the ice melts; the thermometer doesn't climb even though the burner keeps supplying heat
Variables
- Independent variable: time t (s)
- Dependent variable: temperature T (°C)
- Control variables: the same burner setting, the same starting mass of ice, the same beaker, the same thermometer position in the beaker
Apparatus
| Equipment | Purpose | Resolution |
|---|---|---|
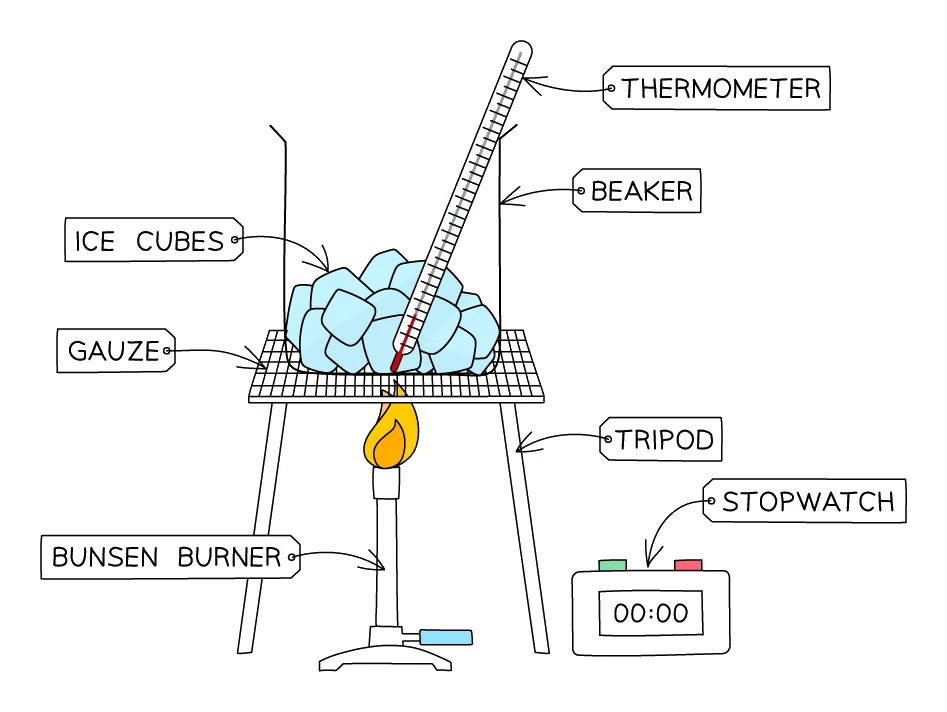
| 400 ml beaker | Holds the ice and water | — |
| Crushed ice cubes (enough to fill about half the beaker) | The sample being heated | — |
| −10 °C to 110 °C thermometer | Reads the sample temperature | 0.1 °C |
| Tripod, gauze and Bunsen burner | Heat source under the beaker | — |
| Heatproof mat | Sits between the bench and the burner | — |
| Stopwatch | Times the readings | 0.1 s |
| Glass stirring rod | Stirs to keep the temperature even through the sample | — |
Method
- Fill the beaker about half-full with crushed ice. Add a small splash of cold water if needed so the bulb of the thermometer is properly surrounded by the sample
- Hold the thermometer vertically with its bulb in the middle of the ice (clamp it if possible, and don't let it touch the bottom of the beaker)
- Light the Bunsen burner and adjust to a small, steady flame. Start the stopwatch
- Stir the sample gently with the glass rod and record the temperature every 30 s
- Continue past the point where all the ice has melted and the water starts to heat
- Stop once the water reaches a temperature near 90 °C (don't take to boiling for safety)
Analysis
- Plot a graph with temperature up the y-axis and time along the x-axis
- The resulting curve splits into three sections:
- A gentle rise from below 0 °C up to 0 °C, where the ice itself is warming
- A flat plateau sitting at 0 °C while the ice and water coexist; the heat going in is overcoming the forces of attraction between particles (filling the potential store rather than the kinetic one), so the thermometer reading stops climbing
- A steeper rise from 0 °C upwards once all the ice has melted and the water alone is being heated
- The length of the flat region tells you how much energy was needed to melt all the ice (you can calculate this from
energy = power × time)
Sources of error and safety
- Systematic, thermometer touching the bottom of the beaker. The glass is hotter than the ice during heating, so the reading is too high. Suspend the bulb in the sample
- Systematic, burner flame turned up too high. A fast heat input drives the temperature past 0 °C before the flat region is clearly visible. Use a low flame
- Random, temperature gradients within the beaker. Stir gently between readings so all the sample is at the same temperature
- Safety. Wear goggles; stand throughout the experiment so any spill is dealt with quickly; ensure the heatproof mat is under the burner; let the apparatus cool fully before clearing away