MathematicsExam code: 0580
Real Life Graphs
Coordinate Geometry and Graphs
Conversion Graphs
Reading a value off
- Two quantities that are linked by a fixed rule can be plotted as one straight line, and that line is a conversion graph: either quantity can be found from the other
- Typical pairs are kilometres and miles, litres and gallons, one currency and another, or a charge against the amount used
- To convert, start on the axis holding the value you have, go across or up to the line, then turn and read the other axis
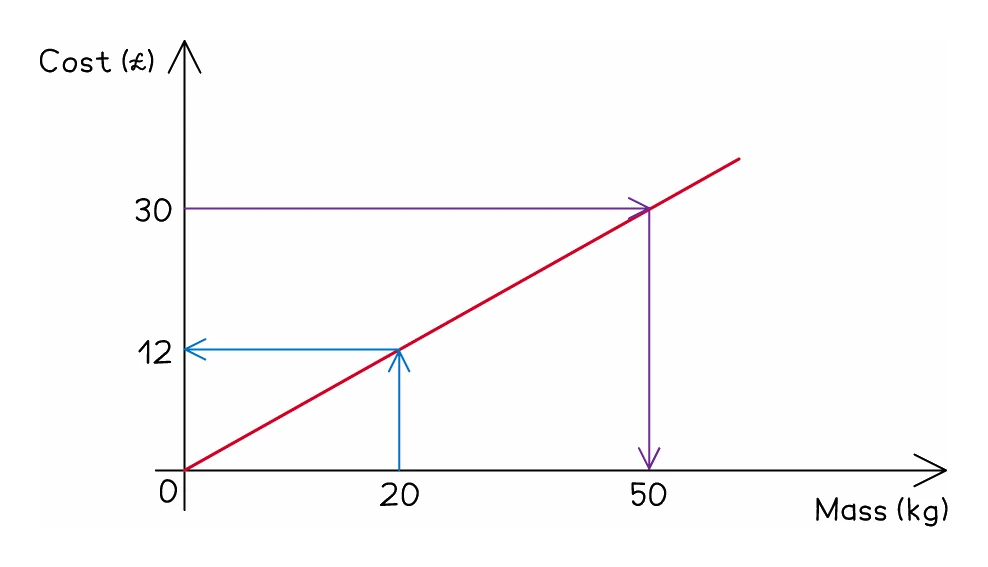
- Draw those two lines on the graph in pencil, because the examiner credits the reading and the working shows where it came from
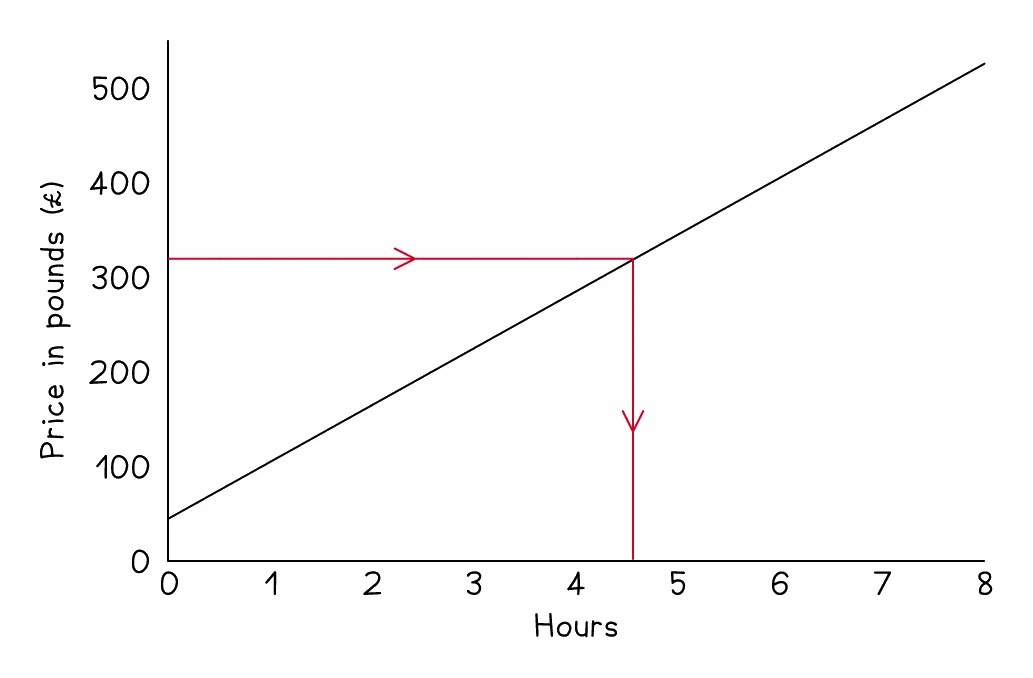
- Read the scale on each axis before anything else, since one square is very often not one unit
Graphs through the origin, and graphs that are not
- A line through the origin means the two quantities are in direct proportion, so values can be scaled up
- If 80 km reads as 50 miles, then 240 km is three times as far, giving 150 miles
- A line that starts part way up the vertical axis has a fixed amount built in, and scaling then fails
- A taxi charging £3 before it moves plus £2 for each mile starts at £3 and reaches £13 after 5 miles
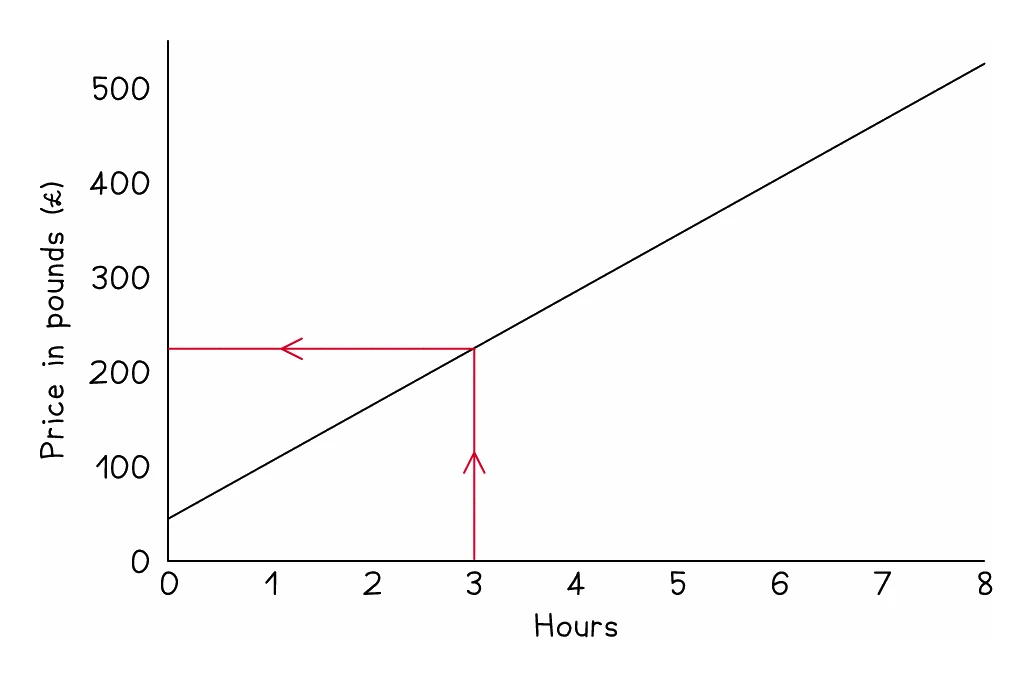
- That starting value is the fixed charge, read where the line meets the vertical axis
- To convert a value beyond the printed grid on such a graph, find the equation of the line instead of scaling
Worked example
Reading a conversion graph both ways
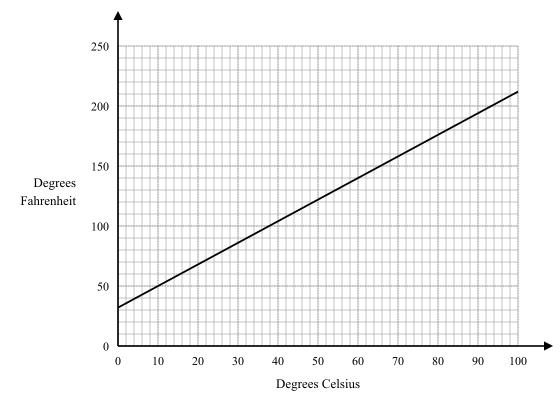
The graph converts between degrees Celsius and degrees Fahrenheit. Use it to convert 100 °F into °C, and 60 °C into °F.
Solution:
- For 100 °F, start on the vertical axis because Fahrenheit is the quantity given
- Go across from 100 until the line is reached, then straight down to the Celsius axis
- The reading is a little under 38, so 100 °F is about 37.5 °C
- For 60 °C, start on the horizontal axis this time
- Go up from 60 until the line is reached, then straight across to the Fahrenheit axis
- The reading is 140 °F
- The line does not pass through the origin: at 0 °C it is already at 32 °F, so these two scales cannot be converted by multiplying alone