MathematicsExam code: 0580
Real Life Graphs
Coordinate Geometry and Graphs
When the rate itself changes
- On a curve the steepness keeps changing, so the rate of change differs from point to point and one gradient cannot describe it
- To find the rate at one moment, draw a tangent at that point and work out its gradient, exactly as in the further graphs topic
- On a travel graph a tangent gives the speed at that instant; on a speed–time graph it gives the acceleration
- A curve getting steeper means the rate is increasing, and a curve flattening out means it is decreasing
Matching a graph to a situation
- A question can show a container being filled at a steady rate and ask which depth-against-time graph fits it
- Reason from the width of the container, since a steady inflow raises the level faster where the container is narrower
- Straight sides give a straight line, because the depth rises at one steady rate
- A container narrowing towards the top gives a curve that steepens
- A container widening towards the top gives a curve that flattens
- The same reasoning matches any pair of quantities, so read the axis labels and ask what one unit of the horizontal quantity does to the vertical one
Worked example
Matching each container to its graph
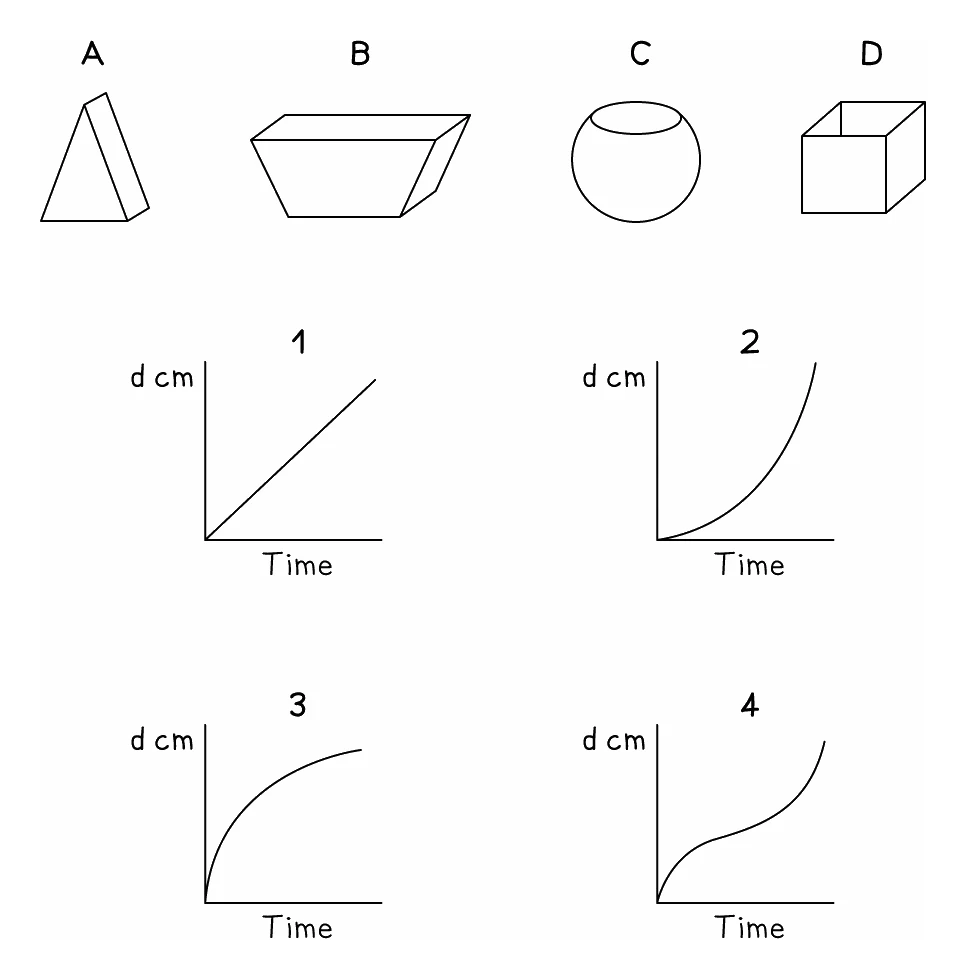
Each graph shows the depth of water, d cm, in one of the containers as it is filled from a tap running at a constant rate. Match each graph to its container.
Solution:
- The water goes in at a steady rate, so the depth rises fastest where the container is narrowest
- Graph 1 is straight, so the depth rises at one steady rate all the way up, which needs a container of constant width
- Graph 1 is container D, the cuboid with vertical sides
- Graph 2 starts shallow and steepens, so the depth rises faster and faster, which needs a container narrowing towards the top
- Graph 2 is container A
- Graph 3 starts steep and flattens, so the depth rises more and more slowly, which needs a container widening towards the top
- Graph 3 is container B
- Graph 4 is steep, then shallow, then steep again, which matches narrow, then wide, then narrow
- Graph 4 is container C, the round flask
- Read the shape of each curve first and describe it in words before looking at the containers, because the reasoning is the same every time