MathematicsExam code: 0580
Real Life Graphs
Coordinate Geometry and Graphs
Reading motion off the graph
- A speed–time graph puts speed on the vertical axis and time on the horizontal one, so it looks similar to a travel graph but says something quite different
- Check the vertical axis label first, because reading one as the other makes every answer wrong
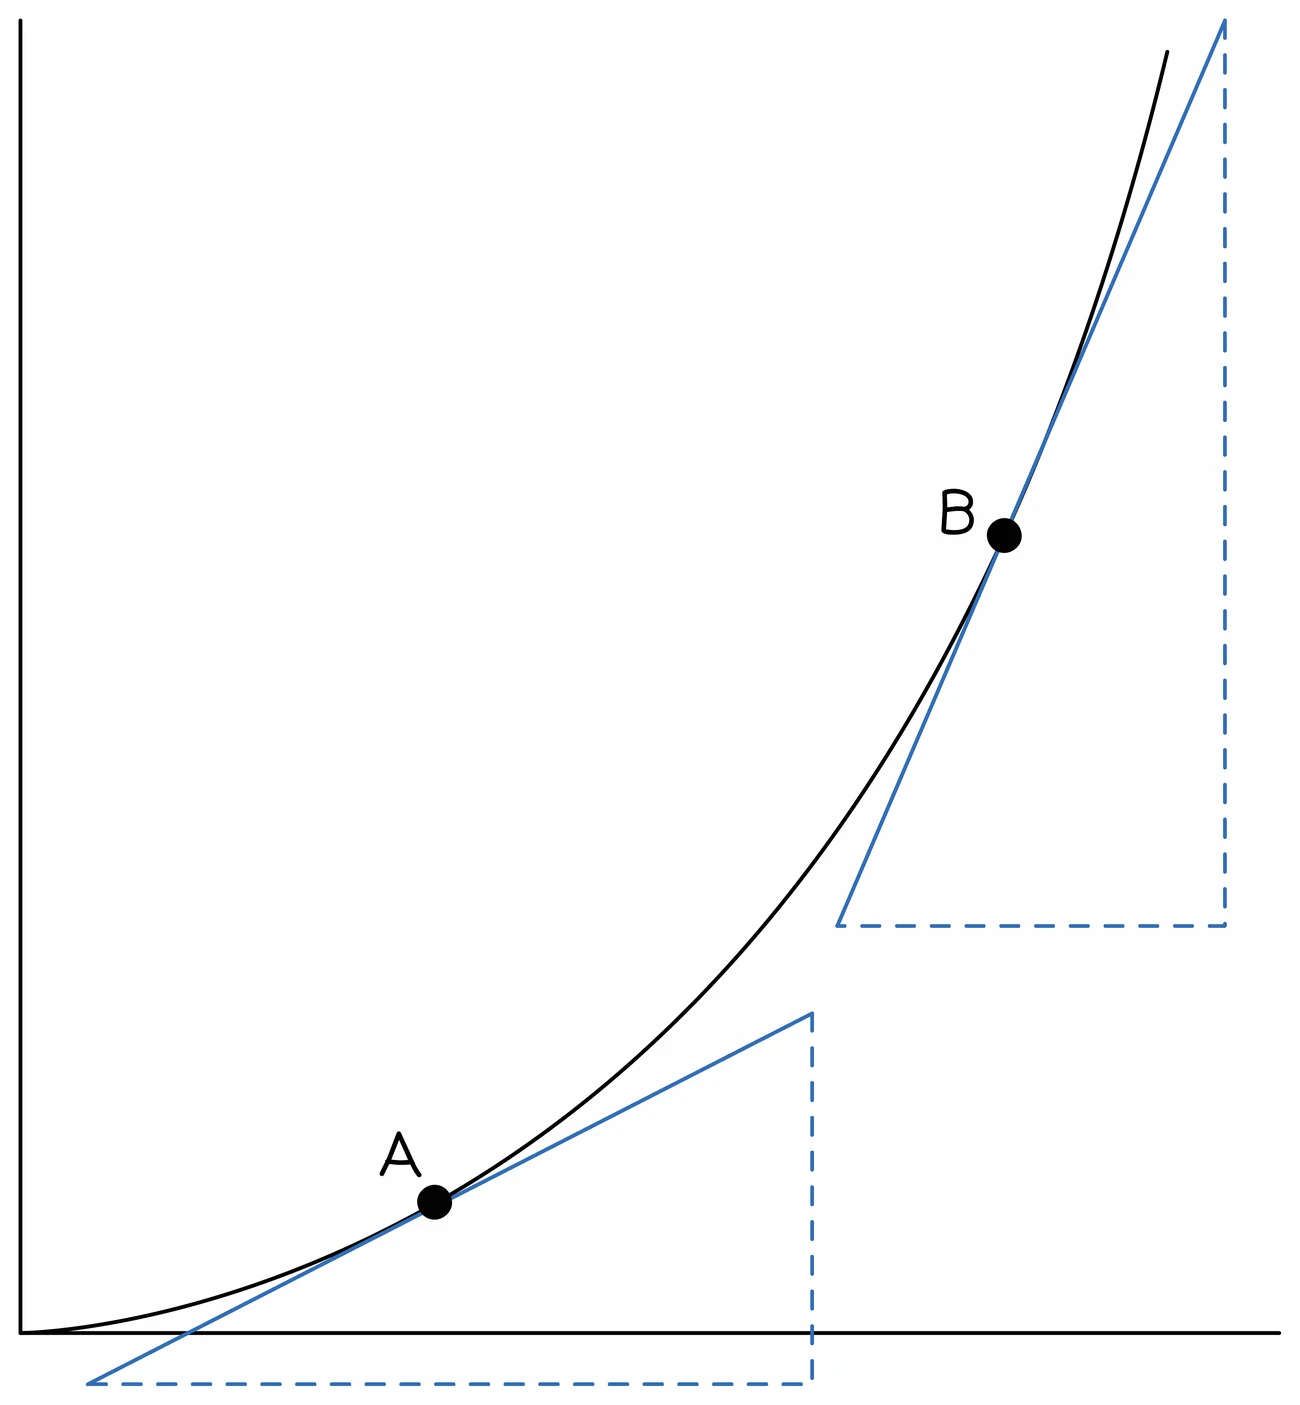
- Here the gradient is the acceleration, found as the change in speed divided by the time taken
- The units are the speed units divided by the time units, so metres per second against seconds gives m/s²
- A line sloping up is speeding up, and a line sloping down is slowing down, which is called deceleration
- A horizontal line means constant speed, and a horizontal line at zero means the object is at rest
- A straight sloping line means the acceleration is constant, while a curve means it is changing
Distance from the area
- The distance travelled is the area between the graph and the time axis
- On this specification the area you are asked for lies under straight sections of the graph only, so it splits into rectangles, triangles and trapeziums
- Work out each piece separately and add them, or treat the whole shape as one trapezium where that fits
- Check the units before writing the answer down, since a question may want the distance in kilometres when the axes are in metres and seconds
Worked example
Acceleration and distance from a speed–time graph
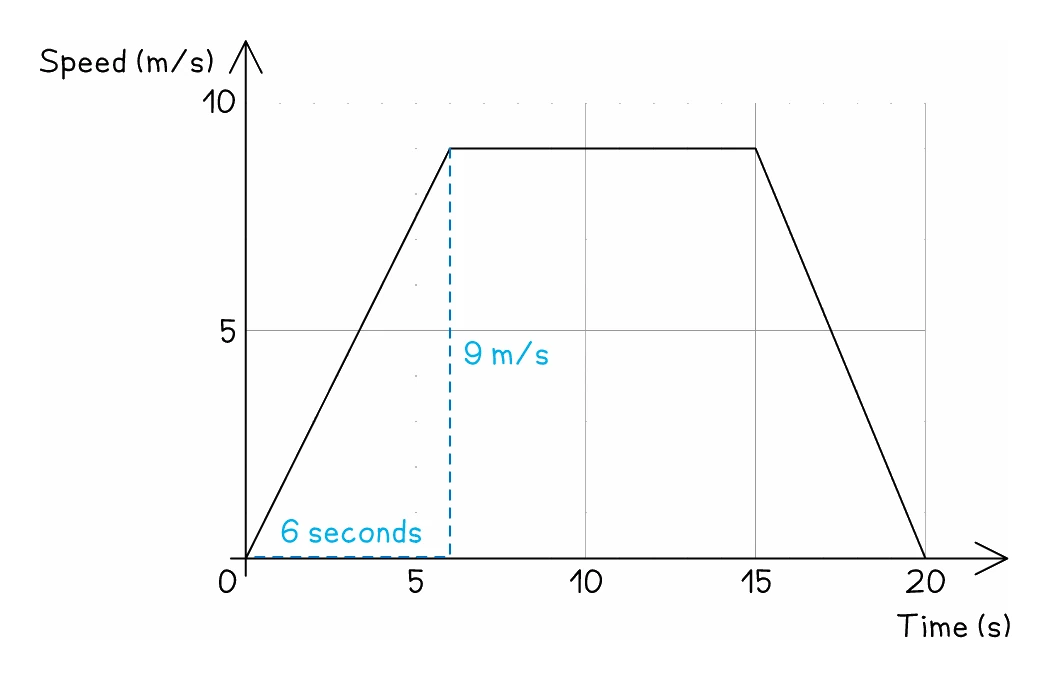
The graph shows the first 20 seconds of a car journey. Find the acceleration over the first 6 seconds, and the total distance travelled.
Solution:
- Over the first 6 seconds the speed rises from 0 to 9 m/s
- Acceleration = change in speed ÷ time = 9 ÷ 6 = 1.5 m/s²
- For the distance, find the area between the line and the time axis, splitting it into three pieces
- The first piece is a triangle: ½ × 6 × 9 = 27 m
- The middle piece is a rectangle: (15 − 6) × 9 = 9 × 9 = 81 m
- The last piece is a triangle: ½ × (20 − 15) × 9 = ½ × 5 × 9 = 22.5 m
- Total distance = 27 + 81 + 22.5 = 130.5 m
- The whole shape is a trapezium, so it can be done in one step as a check: ½ × (20 + 9) × 9 = 130.5 m