MathematicsExam code: 0580
Further Graphs and Tangents
Coordinate Geometry and Graphs
Reading the answers off
- The solutions of an equation are the x values where two graphs meet
- Where the equation is set equal to zero, the answers are where the curve crosses the x-axis
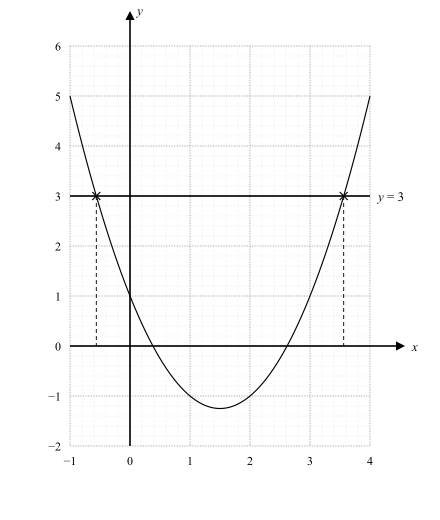
- Where it is set equal to a number, draw that horizontal line and read across
- Where two curves are given, the meeting points solve them simultaneously, and there the y values are wanted too
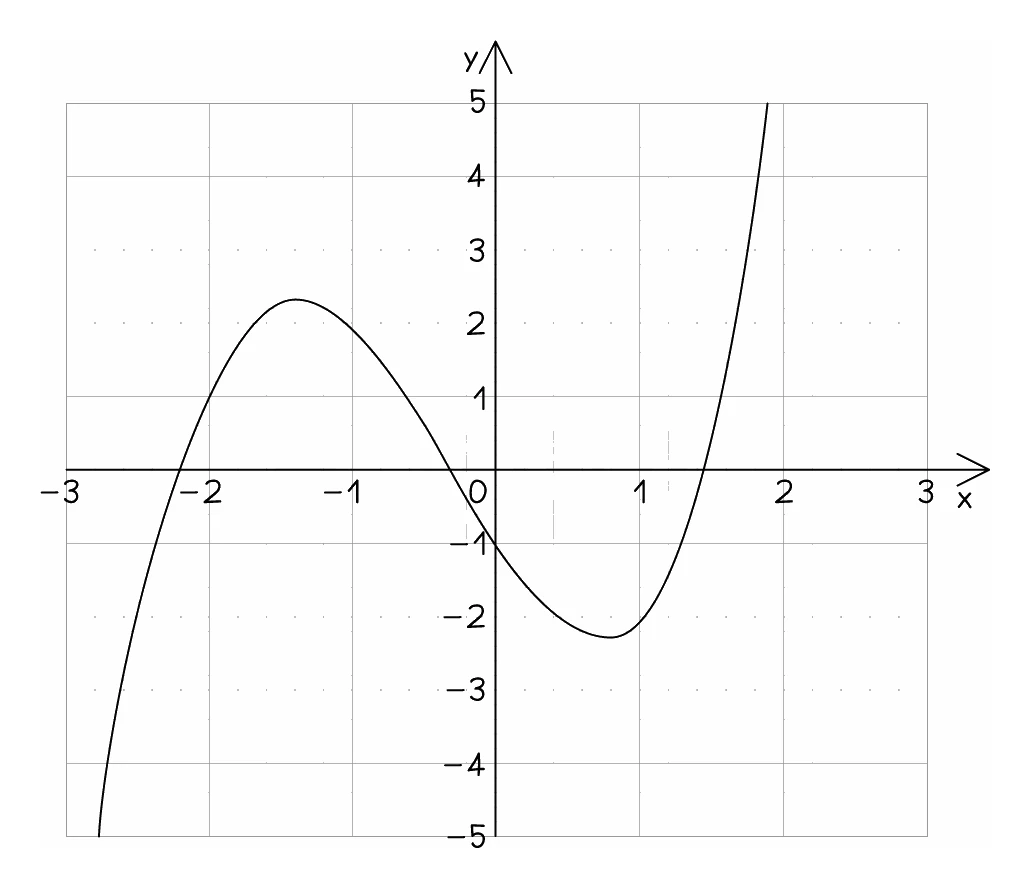
- Read to within half of the smallest square, the accuracy the syllabus sets, and give the x values only, unless the question asks to solve simultaneously
When the equation is not the one plotted
- A question often asks you to solve an equation that is not the one drawn
- Rearrange the new equation until one side is exactly the expression that was plotted
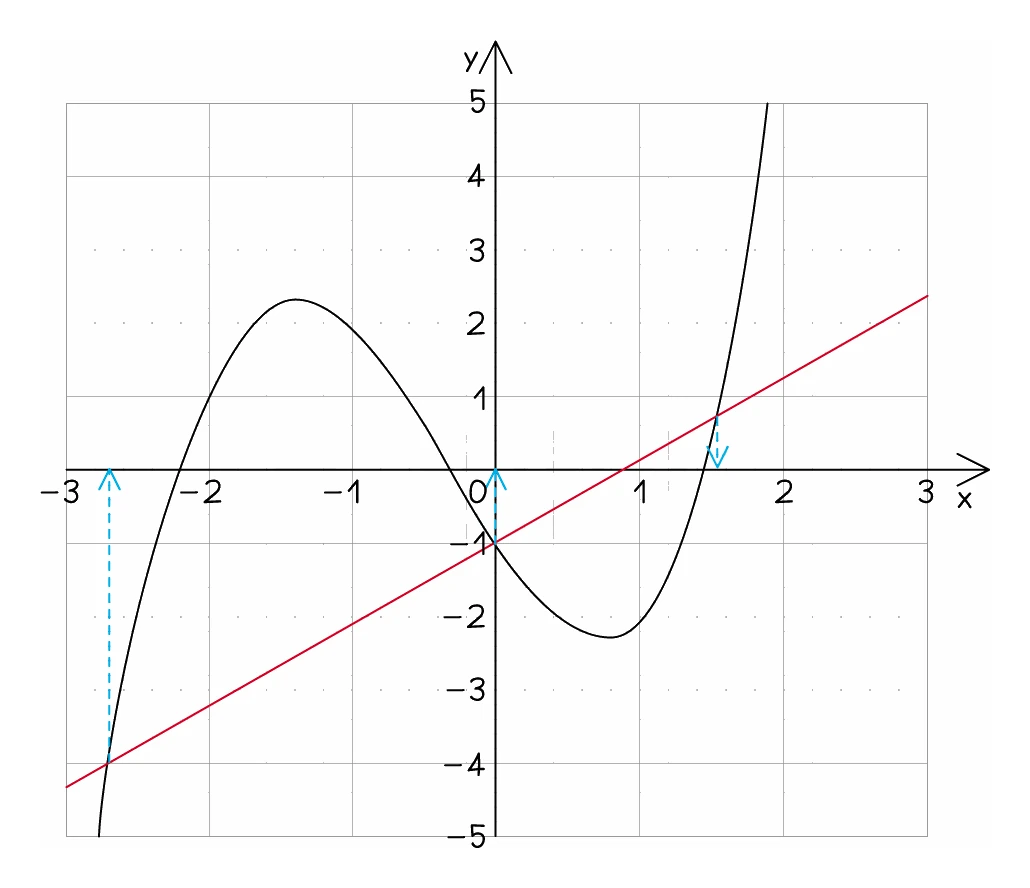
- Whatever is left on the other side is the line you must draw on the grid
- Then read off the x values where that line cuts the curve
Exam tip
Write down the line before you draw it
When you are told to solve an equation by drawing a line on the graph, the line itself earns marks. Write its equation in your working, because that alone often earns one, then rule it right across the grid so it meets the curve at every solution. The answers depend on that line: correct values read off with no correct line drawn usually earn just one special-case mark.
Worked example
Choosing the line to draw
The graph of y = x² − 3x + 1 is drawn on a grid. Explain how to use it to solve x² − 3x − 2 = 0.
Solution:
- The plotted expression is x² − 3x + 1, so make that appear on one side of the new equation
- Start from x² − 3x − 2 = 0
- Add 3 to both sides: x² − 3x + 1 = 3
- The left side is now exactly the plotted curve
- The line to add to the grid is therefore y = 3
- The solutions are the x values where that line meets the curve