Exam Frequency Analysis
Past paper frequency (2018 to 2024)
This topic accounts for approximately 5% of your exam marks.
stable
Rare
Stable5%
Life cycle of stars and the Hertzsprung-Russell diagram appear as descriptive multi-mark questions.
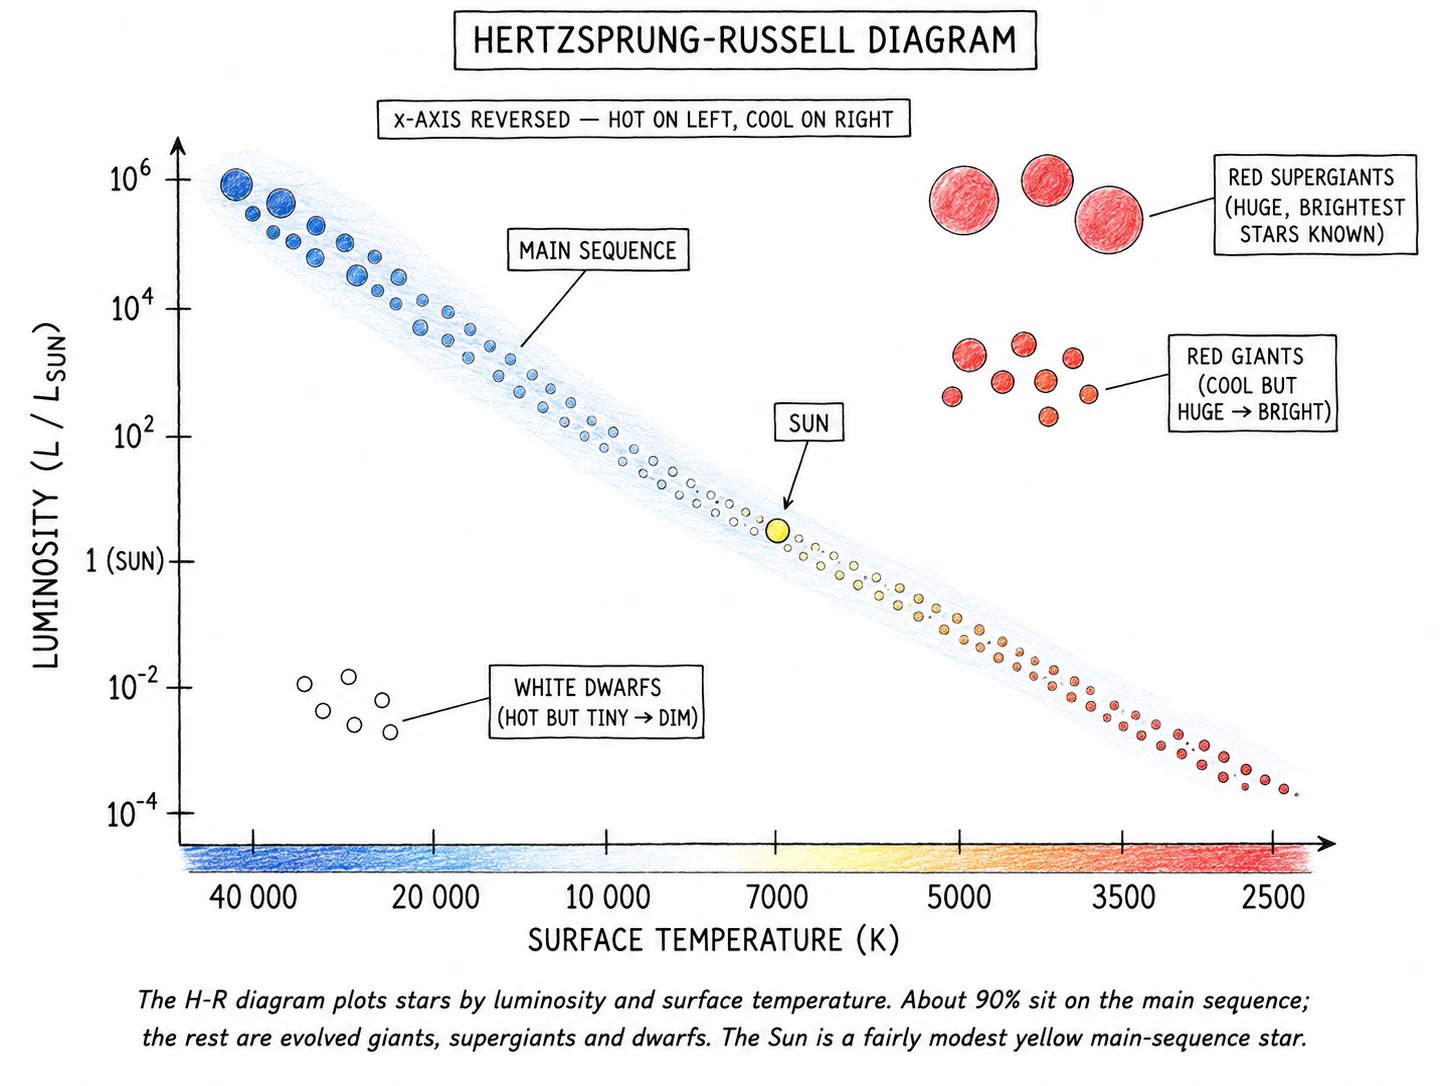
What an HR diagram is
- A Hertzsprung–Russell (HR) diagram is a plot that arranges stars by their two most important properties:
- on the vertical axis (more luminous stars near the top, less luminous near the bottom). Often plotted on a log scale, with the Sun's luminosity = 1 as a reference point
- Surface temperature on the horizontal axis, plotted backwards, with the hottest (blue) stars on the left, the coolest (red) stars on the right
- The diagram is named after the two astronomers who discovered it independently in the early 20th century
The reversed temperature axis
- The horizontal axis runs from high temperature on the left to low temperature on the right, the opposite way round from a normal physics graph. This is a historical convention you just have to remember
- The colour of each region of the diagram matches the temperature scale: blue on the left, white-yellow in the middle, orange-red on the right
The four key regions
A scatter plot of all stars in the night sky reveals four clusters:
- The main sequence is a long, diagonal band of stars running from the top-left (hot, luminous, blue) to the bottom-right (cool, dim, red). About 90% of all stars lie on the main sequence at any given time. The Sun sits on the main sequence in the middle of the band
- form a clump of stars in the bottom-left, which are hot (which would normally mean blue) but dim (because they are tiny). They lie below the main sequence
- form a cluster in the upper-right, which are cool (red) but bright (because they are huge). They sit above the main sequence
- sit at the very top-right, even cooler and even more luminous than red giants. They are the brightest stars known by sheer luminosity
What a star's position tells you
| Region | Temperature | Luminosity | Size |
|---|---|---|---|
| Top-left main sequence | Hot (blue) | Very high | Large hot blue stars |
| Middle main sequence | Yellow | Moderate | Sun-like stars |
| Bottom-right main sequence | Cool (red) | Low |
Exam tip
Star types on an HR diagram
Matching labelled regions of an HR diagram to star types comes up, so you need to know: the main sequence runs top-left to bottom-right, white dwarfs sit bottom-left (hot but dim), and red giants sit upper-right (cool but bright). Give exactly one star type per region.
Reading the life cycle off an HR diagram
- A star's position on the HR diagram changes over its lifetime as it evolves through the stages described in sections 3 and 4
- For a solar-mass star:
- Main sequence: sits at the Sun's position for billions of years
- Red giant: moves up and to the right (cooler surface, much higher luminosity because the star is huge)
- White dwarf: moves down and to the left (much hotter exposed core, much lower total luminosity because the star is tiny)
- For a massive star:
- Main sequence: top-left of the diagonal band (hot, blue, very luminous)
- Red supergiant: moves all the way across to the upper-right (cools as it expands, stays extremely luminous)
- Supernova → neutron star or black hole: leaves the HR diagram altogether; the remnants are too small and dark to plot