Exam Frequency Analysis
Past paper frequency (2018 to 2024)
This topic accounts for approximately 7% of your exam marks.
stable
Low
Stable7%
Half-life calculations and uses/dangers of radioactive sources appear in most series.
Definition
- Because individual decays are random, you cannot say "this particular nucleus will decay at 3:42 pm"
- What you can measure precisely is how long it takes for a large sample to halve. This is the half-life:
the of a radioactive isotope is the time taken for the number of unstable nuclei in a sample to fall to half of its original value
- Equivalently, since activity is proportional to the number of unstable nuclei, half-life is the time for the of the sample to drop to half its starting value
- Half-life is a property of the isotope itself. Every nucleus of a given isotope has the same probability of decaying per second, so the half-life is constant, and temperature, pressure and chemistry have no effect
Exam tip
Defining half-life (two marks)
What comes up: "State the meaning of half-life" — a 2-mark question that recurs across many papers.
Write (two marks): (1) the time taken; (2) for the (radio)activity (or count rate, or the number of radioactive nuclei) to fall to half its original value.
Watch out: writing "half the time" as the first mark point scores zero — the mark scheme explicitly rejects this phrasing. You must say "the time taken" (or "how long it takes"). Both marks require a time component and a what-halves component; giving only one earns only one mark.
Half-lives vary enormously
- Different isotopes have wildly different half-lives:
| Isotope | Half-life | Use |
|---|---|---|
| Polonium-214 | ≈ 0.0002 s | Found in radon decay chains |
| Technetium-99m | ≈ 6 hours | Medical tracer |
| Iodine-131 | ≈ 8 days | Treating thyroid cancer |
| Carbon-14 |
Worked example
Activity remaining after several half-lives
A radioactive source has an initial activity of 960 Bq. Its half-life is 4 hours. Find the activity after 20 hours.
Solution:
- Number of half-lives elapsed: 20 ÷ 4 = 5
- Halve the activity once for each half-life:
- After 1 half-life (4 h): 960 ÷ 2 = 480 Bq
- After 2 half-lives (8 h): 480 ÷ 2 = 240 Bq
- After 3 half-lives (12 h): 240 ÷ 2 = 120 Bq
- After 4 half-lives (16 h): 120 ÷ 2 = 60 Bq
- After 5 half-lives (20 h): 60 ÷ 2 = 30 Bq
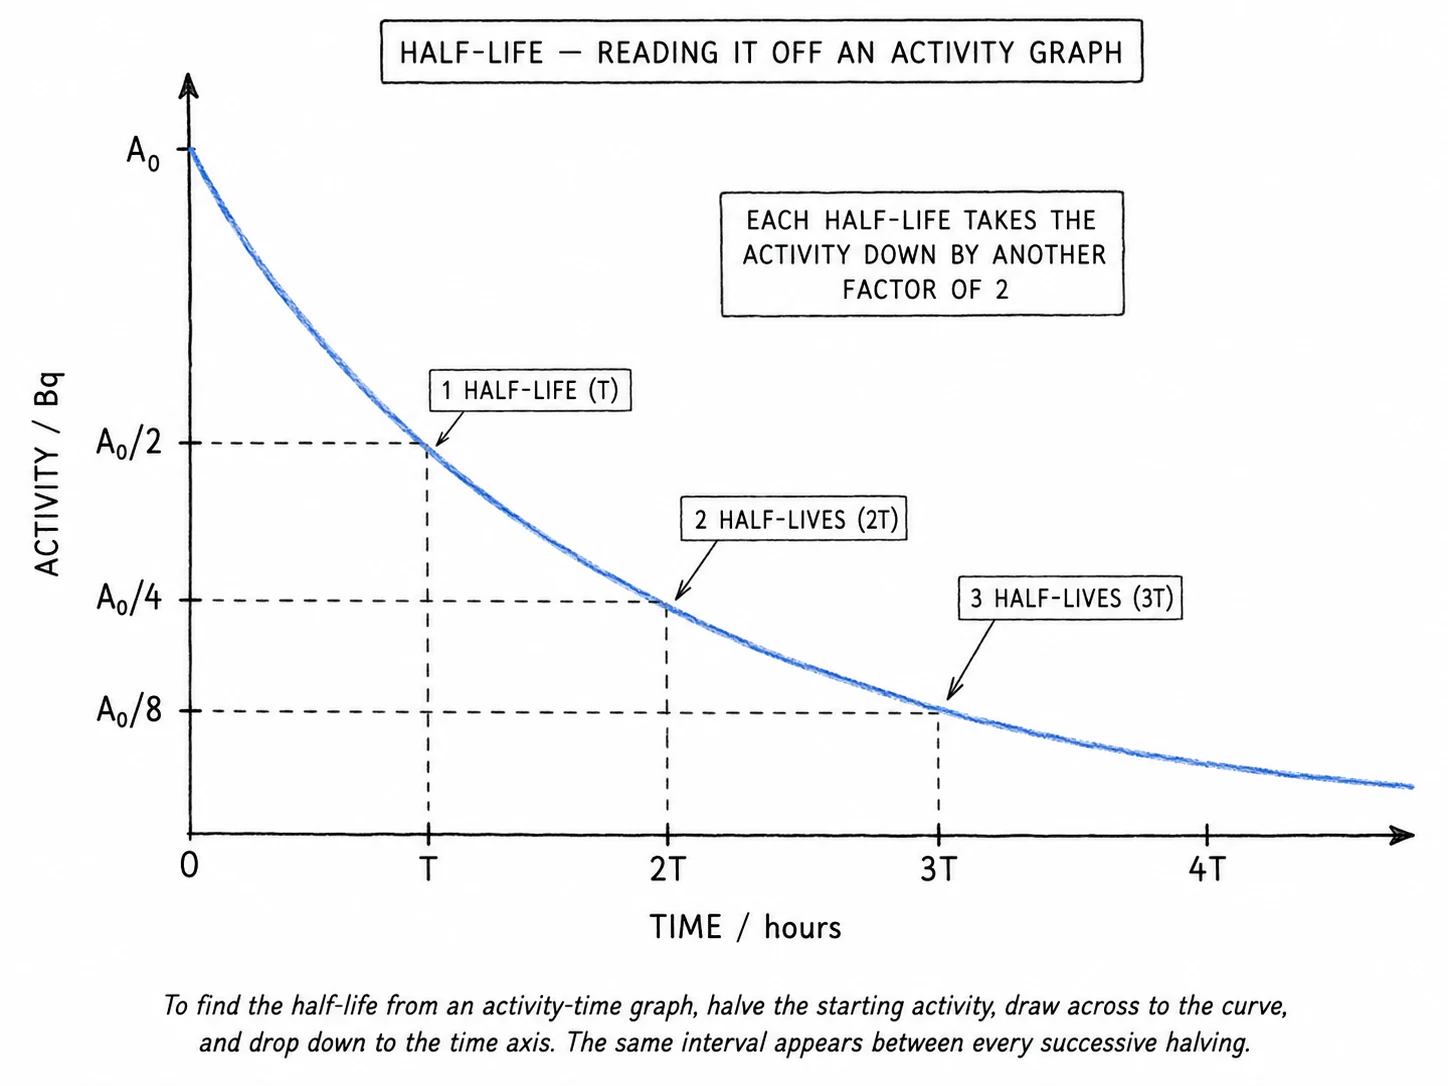
Reading a half-life from a graph
- To find the half-life from an activity-time graph:
- Read off the initial A₀ from the y-axis at t = 0
- Halve it to get A₀/2
- Draw a horizontal line from A₀/2 across to the curve, then drop straight down to the time axis
- The reading on the time axis is the
- It is a good idea to do this a second time (read at A₀/4) and divide the resulting time by 2 to check; you should get the same answer