Exam Frequency Analysis
Past paper frequency (2018 to 2024)
This topic accounts for approximately 12% of your exam marks.
stable
High
Stable12%
Calculating resistance, current and voltage in series and parallel circuits tested every series.
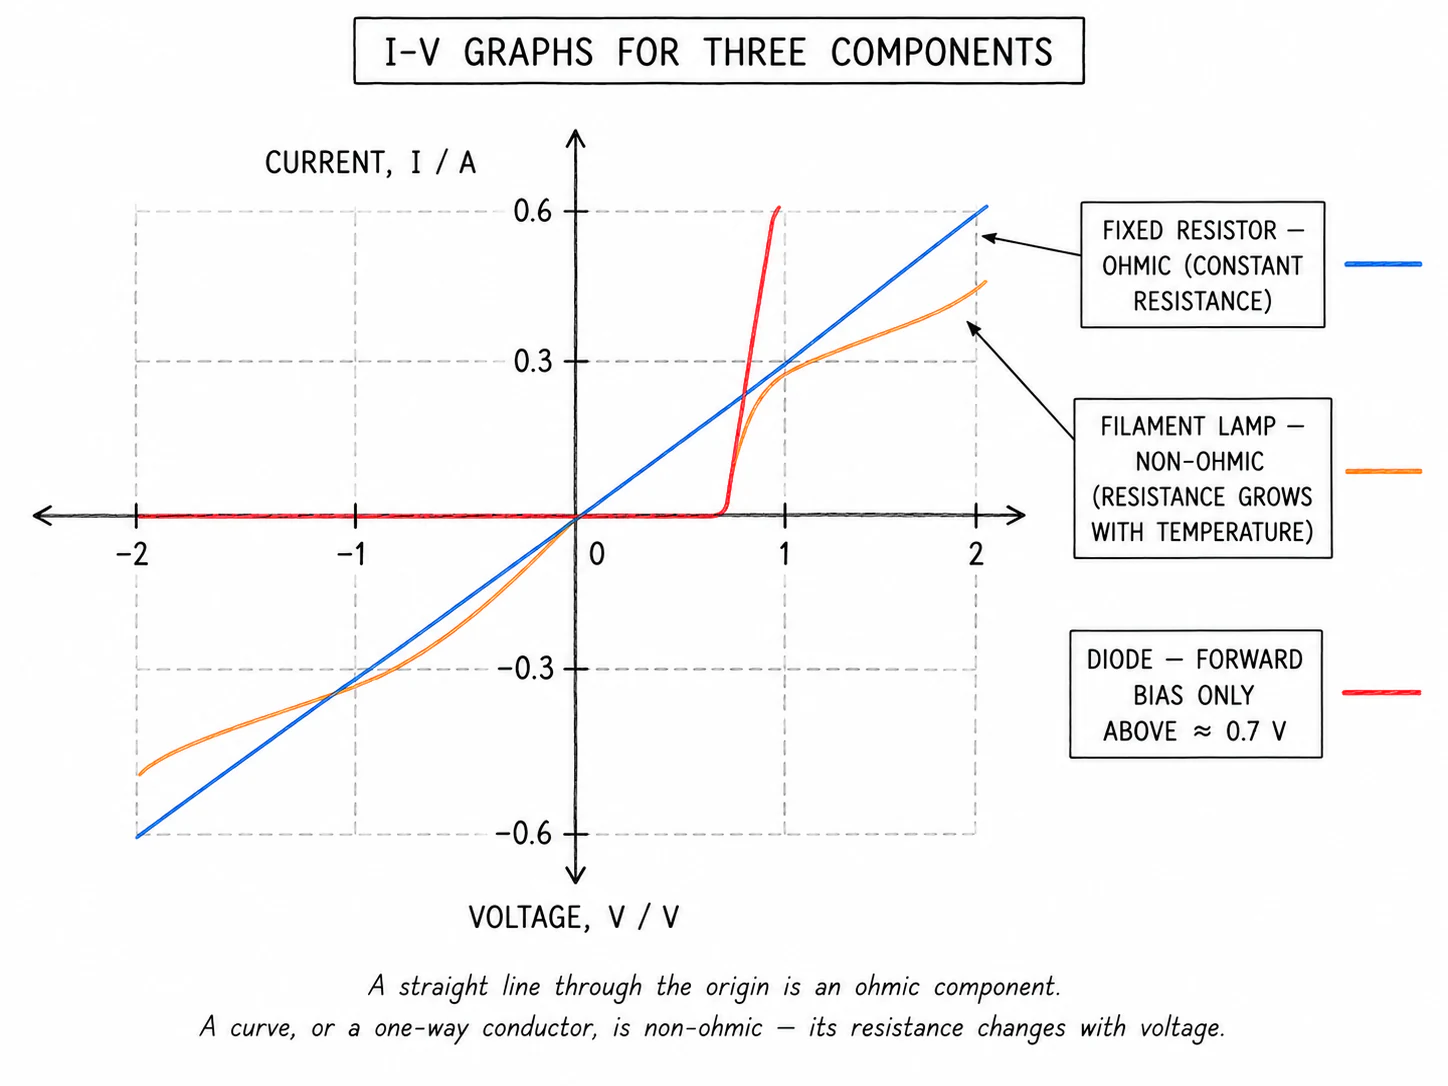
What an I-V graph shows
- An I-V graph plots the current through a component (y-axis) against the voltage across it (x-axis), with the voltage varied from negative through zero to positive
- The shape of the line tells you how the component's resistance changes with the voltage applied:
- A straight line through the origin means the current is directly proportional to the voltage. The resistance is constant (this is ohmic behaviour)
- A curved line through the origin means the current is not directly proportional to the voltage. The resistance is variable (this is non-ohmic behaviour)
- The resistance at any point on an I-V graph is given by R = V / I, not by the gradient. (For an ohmic conductor R = 1/gradient because the line is straight, but in general the V/I ratio at each point is what matters.)
I-V graph for a fixed resistor (or a metal wire at constant temperature)
- A straight line through the origin, because current and voltage are directly proportional, in both polarities
- The slope is the same everywhere, so the resistance is the same everywhere; fixed resistors and wires at a steady temperature are ohmic conductors
I-V graph for a filament lamp
- The curve passes through the origin, but it flattens off as the voltage and current grow; the same shape appears in reverse on the negative side
- A flatter slope corresponds to a higher resistance (because R = V / I and V grows faster than I)
- The physics: a larger current heats the filament; the metal ions then vibrate more vigorously, scattering the drifting electrons more often, so the resistance climbs
- A filament lamp is therefore a non-ohmic component, because its resistance is not constant across its working range
I-V graph for a semiconductor diode
- The diode is a one-way conductor: it lets current pass in the direction of its arrowhead symbol only, which is called forward bias
- In forward bias, almost no current flows until the voltage exceeds about 0.6–0.7 V; past that threshold, the current climbs very sharply with very little extra voltage. The resistance is effectively infinite below the threshold and very small above it
- In reverse bias, no current flows at all (over the normal operating range); the diode's resistance is enormous
- The I-V graph therefore sits flat on the V axis for negative V, hugs the V axis from 0 to about 0.6 V, then rises almost vertically
Exam tip
Explain why the I-V graph of a filament lamp is a curve, not a straight line
What comes up: the exam asks you to explain why the current-voltage graph for a filament lamp curves and flattens at higher voltages, rather than being a straight line through the origin.
Write (two marks): (1) As the current increases, it heats the filament. (2) The resistance of the filament increases with temperature, so the current rises more slowly than the voltage — producing a curve that flattens as voltage grows.
Watch out: do not simply say "the filament heats up" and stop there. The mark scheme requires you to link the heating to a change in resistance, and to show how that changing resistance produces the non-linear shape. One mark for the heating, one mark for stating the resistance changes with temperature (or that this causes the reduced rate of current increase).
Investigating an I-V curve in the lab
- Apparatus:
- the component under test (resistor, filament lamp or diode)
- an ammeter wired in series with the component to read the current through it
- a voltmeter wired in parallel across the component to read the voltage across it
- a variable resistor in series with the component to vary the current
- a cell or low-voltage supply
- Method:
- Build the circuit and set the variable resistor to its highest resistance (so the initial current is small)
- Record the voltmeter and ammeter readings
- Reduce the resistance of the variable resistor by a small step; record V and I again
- Repeat until a wide range of voltages has been swept (do not exceed the rated voltage of the component, or it may burn out)
- To capture the negative side of the curve, reverse the cell's connections and repeat
- Plot I against V with the recorded data points and join them with a smooth curve