MathematicsExam code: 0580
Trigonometric Graphs and Equations
Pythagoras and Trigonometry
Why the graphs matter
- Beyond a right-angled triangle the angle is no longer restricted to acute values, so sin and cos are defined for every angle from 0° to 360° and beyond, and tan for every angle except 90°, 270° and every 180° on from them
- The syllabus asks you to recognise, sketch and interpret y = sin x, y = cos x and y = tan x over 0° ⩽ x ⩽ 360°
- The graphs are what make an equation solvable, because a calculator returns only one answer and the graph reveals the rest
Sine and cosine
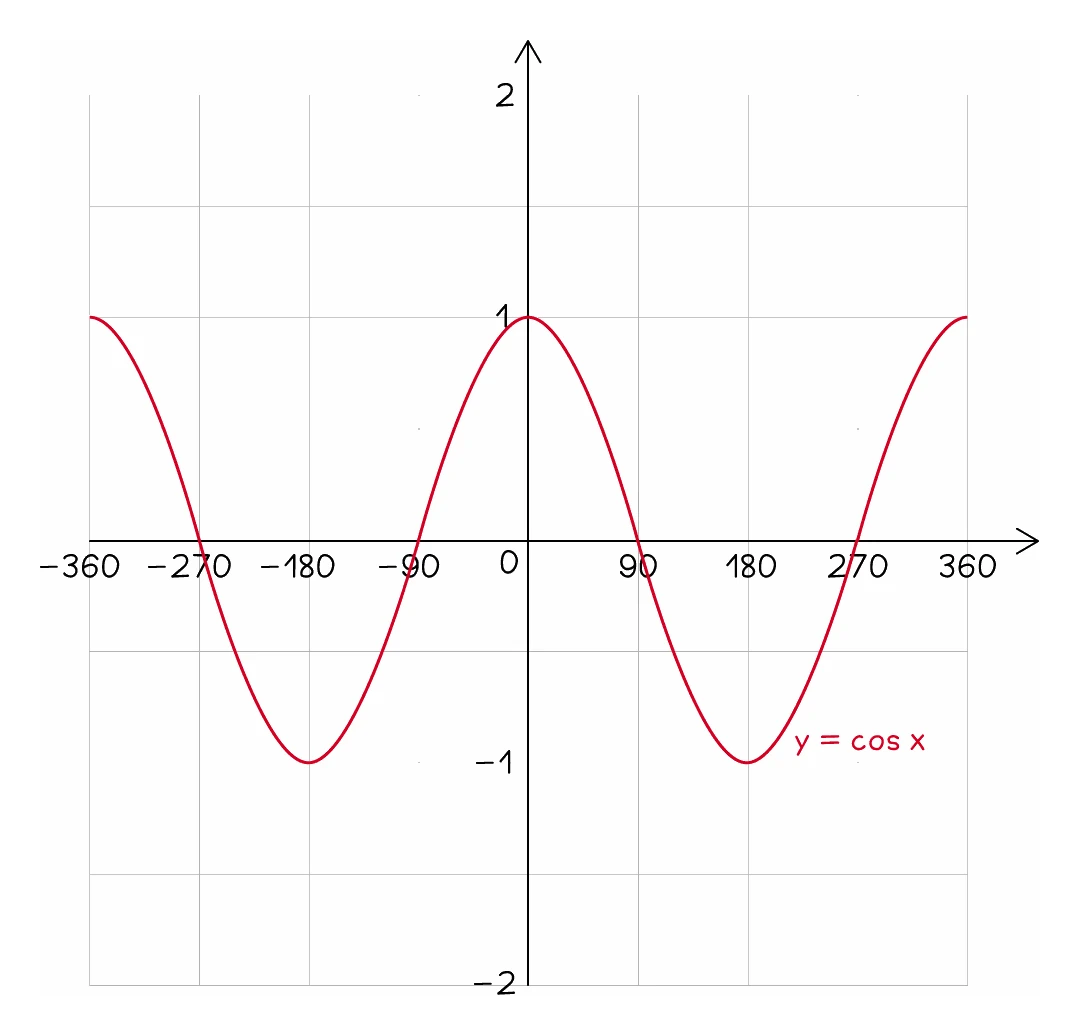
- Both are waves rising to 1 and falling to −1, and both repeat every 360°, which is their period
- Plotting at every multiple of 90° is enough to get the shape right
| x | 0° | 90° | 180° | 270° | 360° |
|---|---|---|---|---|---|
| sin x | 0 | 1 | 0 | −1 | 0 |
| cos x | 1 | 0 | −1 | 0 | 1 |
- y = sin x passes through the origin, while y = cos x starts at its peak, crossing the vertical axis at 1
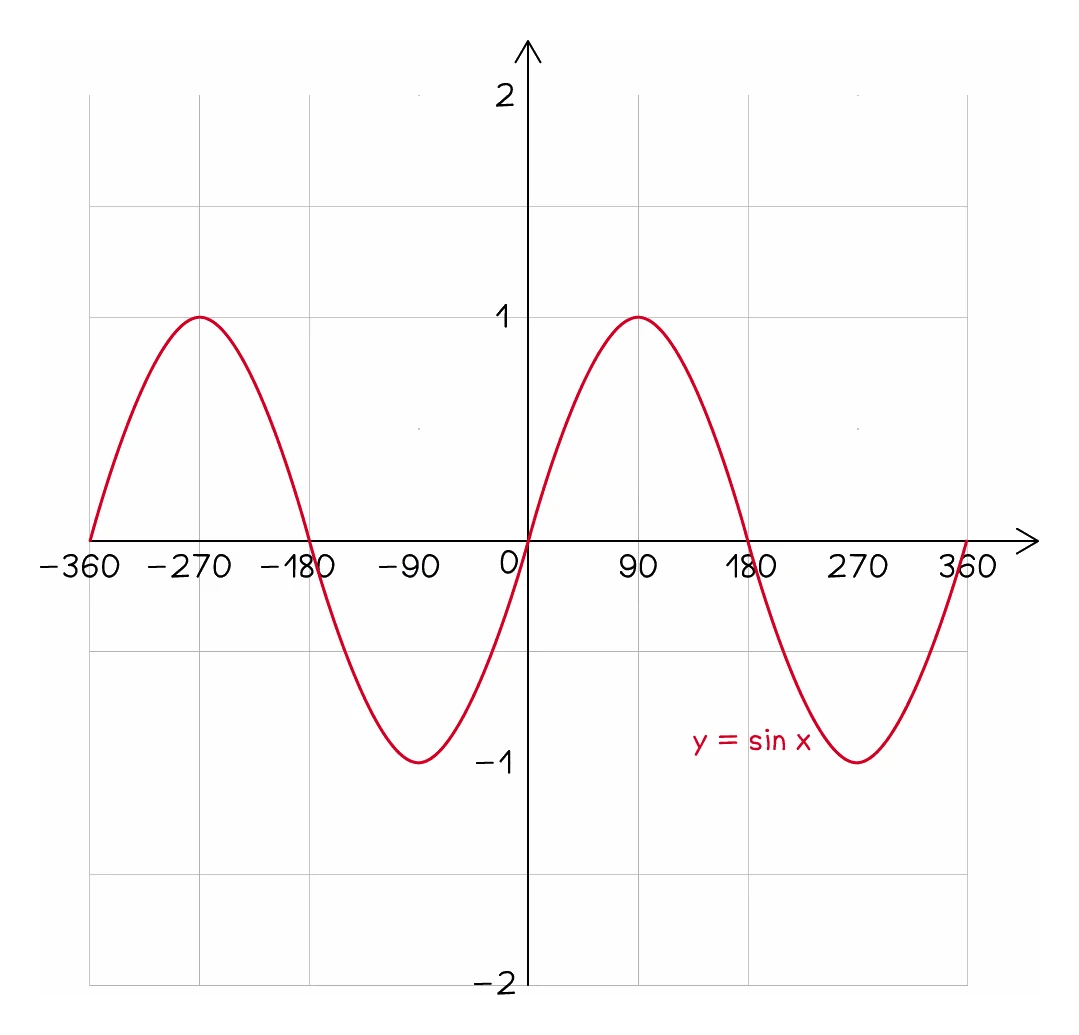
- The cosine curve is the sine curve shifted 90° to the left, so the two have the same shape in different positions
- Sine is symmetrical about x = 90° and cosine about x = 180°, and those symmetries are what generate second solutions
Tangent
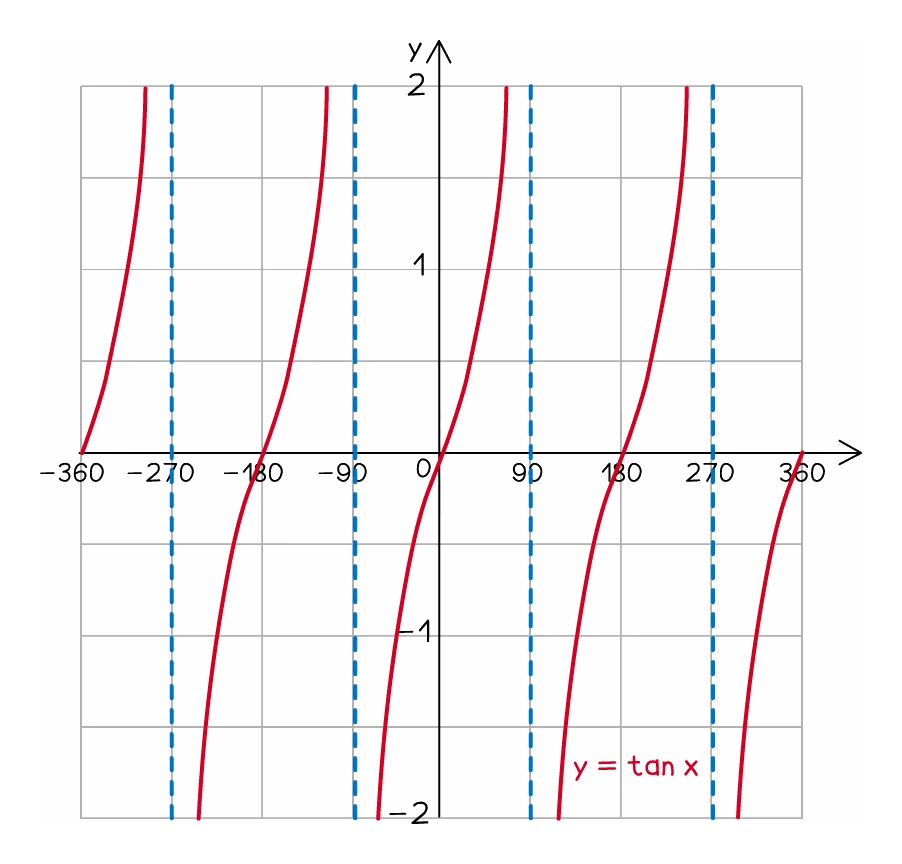
- y = tan x breaks the pattern entirely: rather than one continuous wave it comes in separate branches, repeating every 180°, half the period of the other two
- Each branch climbs from far below the axis to far above it
- Vertical asymptotes sit at x = 90° and x = 270°, where the curve rises without ever reaching the line
- The curve passes through the origin, and through (180°, 0) and (360°, 0)
- Tangent has no value at 90° or 270°, which is why those are drawn as dotted lines rather than points
Worked example
Reading values off the graphs
Use the graphs to write down the value of sin 180°, cos 180° and the two values of x between 0° and 360° for which sin x = √2/2.
Solution:
- The sine curve starts at 0, rises to 1 at 90°, returns to 0 at 180°, falls to −1 at 270° and returns to 0 at 360°
- So sin 180° = 0
- The cosine curve starts at 1, falls to 0 at 90°, reaches −1 at 180°, returns to 0 at 270° and back to 1 at 360°
- So cos 180° = −1
- √2/2 is about 0.71, so draw the horizontal line y = 0.71 across the sine curve
- It cuts the curve twice between 0° and 360°, both times where the curve is above the axis
- √2/2 is the exact value of sin 45°, so the first is x = 45°, with no calculator needed
- The sine curve is symmetrical about x = 90°, so the second is 180 − 45 = 135°
- The two solutions are x = 45° and x = 135°