MathematicsExam code: 0580
Solving and Graphing Inequalities
Coordinate Geometry and Graphs
Which line, and how to draw it
- Replace the inequality sign with an equals sign and draw that line first
- Draw a solid line when the sign is ⩽ or ⩾, because the points along it are included
- Draw a broken line when the sign is < or >, because the points along it are excluded
- Putting a sloping boundary into y = mx + c makes it far easier to plot
- 2x + y ⩽ 8 has boundary 2x + y = 8, which is y = 8 − 2x, meeting the axes at (0, 8) and (4, 0)
- Extend every line right across the grid you are given, not just as far as the region looks like it goes
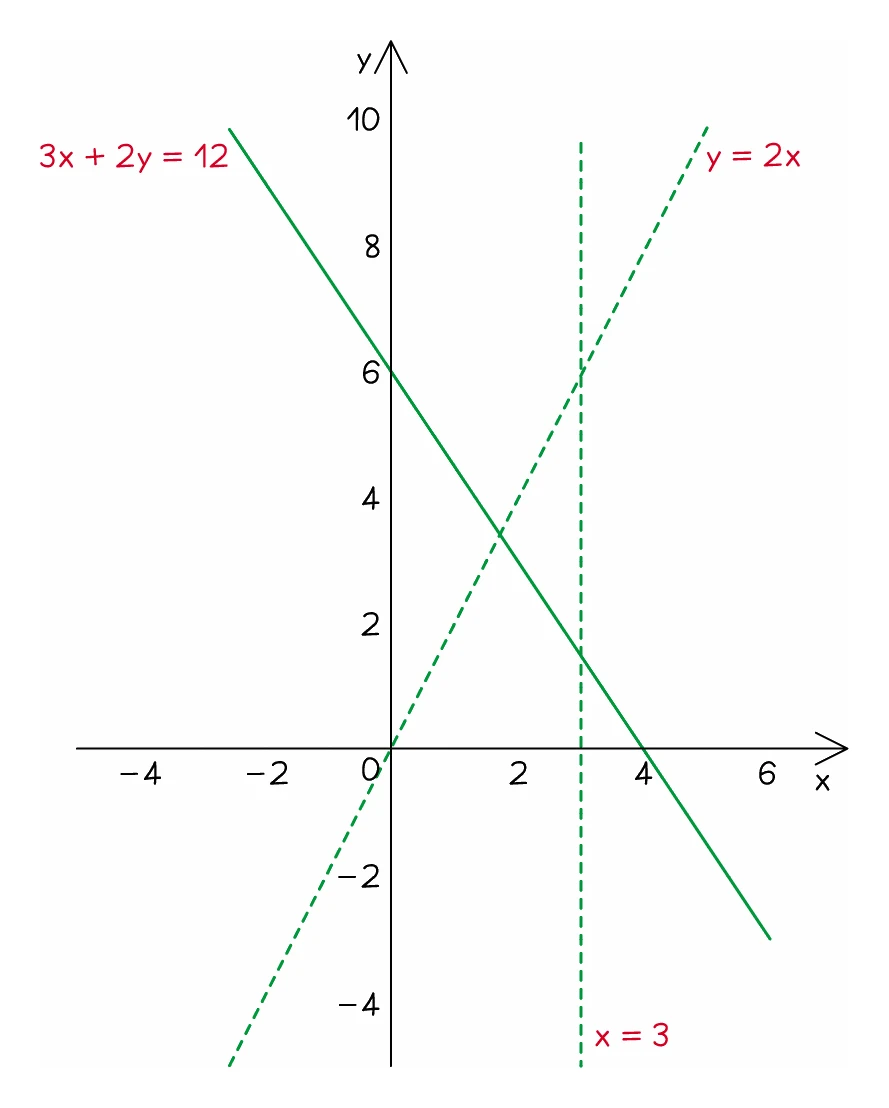
- Each boundary line drawn correctly is worth a mark before any shading happens
Worked example
Choosing the boundary lines
A region is defined by y ⩽ 2x + 1, x > 3 and y ⩾ 0. Describe the three boundary lines you would draw.
Solution:
- Replace each inequality sign with an equals sign to get the boundary
- y ⩽ 2x + 1 gives the line y = 2x + 1, a sloping line through (0, 1) with gradient 2
- The sign is ⩽, which includes the boundary, so that line is drawn solid
- x > 3 gives the line x = 3, a vertical line through 3 on the x-axis
- The sign is >, which excludes the boundary, so that line is drawn broken
- y ⩾ 0 gives the line y = 0, which is the x-axis itself, drawn solid
- Every line is ruled right across the grid, not just along the edge of the region you expect, so that you can see where each pair of lines crosses before you shade