Energetics
Physical Chemistry
Goal of the practical
- Use a polystyrene-cup calorimeter to record how the temperature of a neutralisation reaction varies with the volume of one reactant added, and use the data to identify the volume that gives the largest temperature change
Apparatus
- 100 cm³ polystyrene cup with a fitted lid
- Thermometer (0–110 °C, 0.5 °C divisions) and stirring rod
- 25 cm³ measuring cylinder (×2: one for each reactant)
- 25 cm³ dilute sodium hydroxide solution per run
- Dilute hydrochloric acid (same concentration as the alkali)
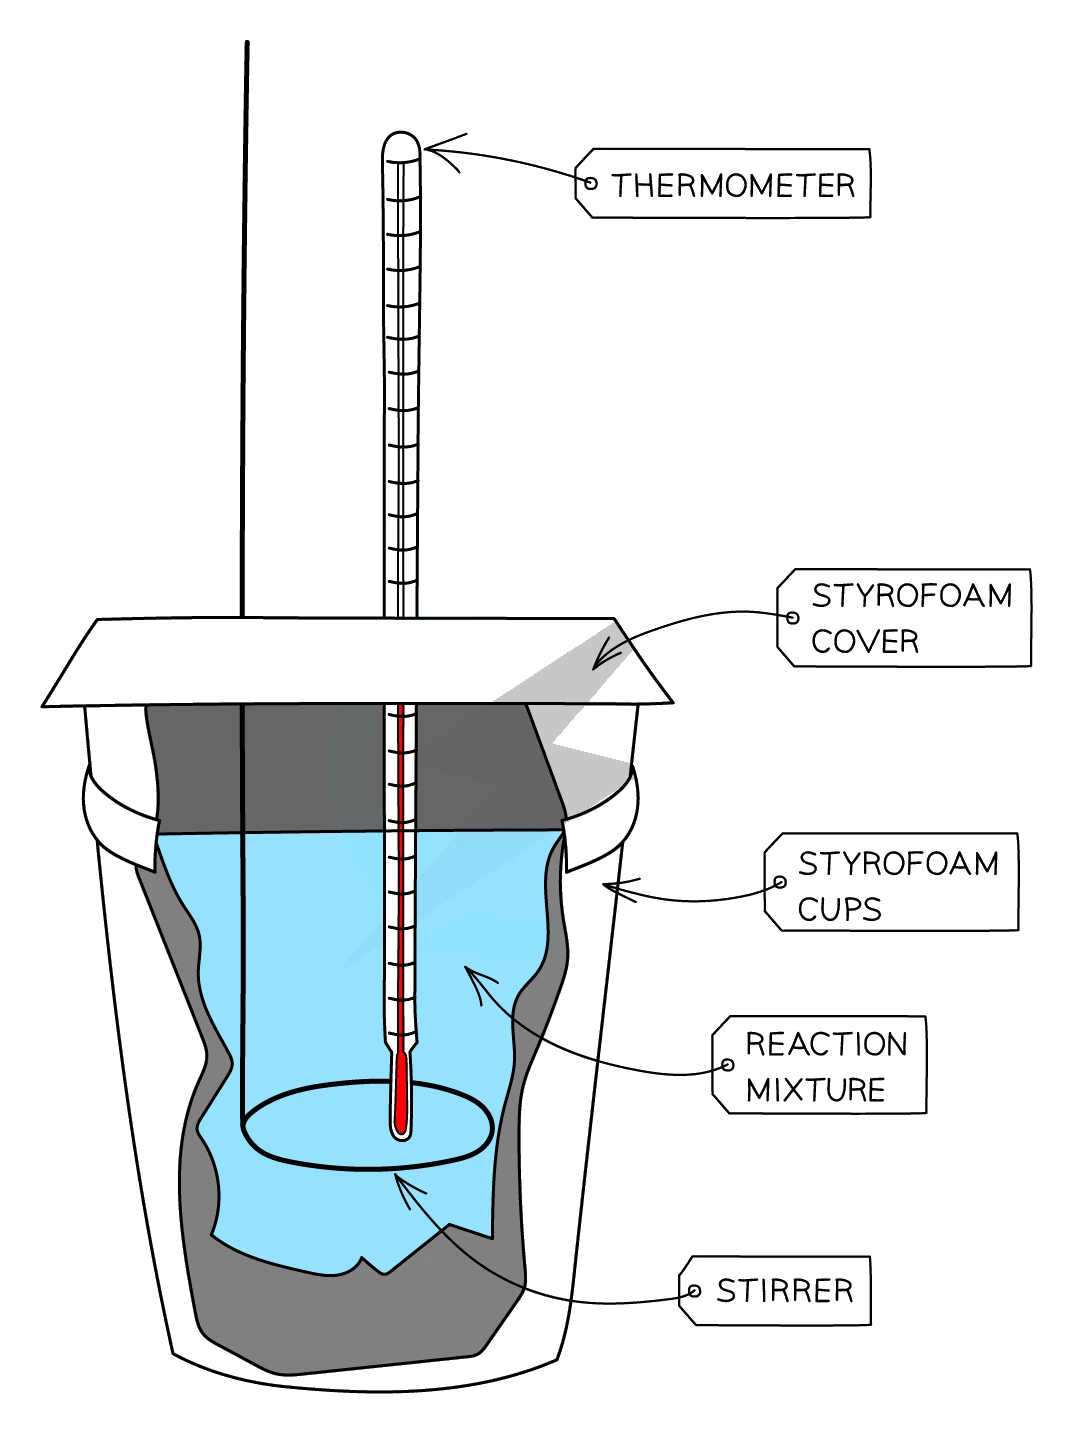
Method
- Measure 25 cm³ of NaOH solution into the polystyrene cup and place on the bench in the cup-and-lid assembly
- Read the temperature once it has settled — this is Tstart
- Measure 5 cm³ of HCl with the second measuring cylinder, add it to the cup, fit the lid, and stir gently with the thermometer
- Read the highest temperature reached — this is Tmax
- Empty and dry the cup, then repeat the run with 10 cm³ of HCl, then 15, 20, 25, 30 and 35 cm³ — stepping past the expected equivalence point so the peak of the curve can be seen clearly
Sample results table
| Volume of HCl added / cm³ | Start temp / °C | Final temp / °C | ΔT / °C |
|---|---|---|---|
| 5 | 21.0 | 22.6 | +1.6 |
| 10 | 21.0 | 24.0 | +3.0 |
| 15 | 21.0 | 24.8 | +3.8 |
| 20 | 21.0 | 25.4 | +4.4 |
| 25 | 21.0 | 26.0 | +5.0 |
| 30 | 21.0 | 25.4 | +4.4 |
| 35 | 21.0 | 24.6 | +3.6 |
Common exam question
Explaining the shape of the temperature graph
Question: Use the graph of temperature change against volume added to find the maximum change, then explain the shape of the graph, or state how the results show the reaction is complete (1–3 marks).
Set in 2 of the 23 papers, once adding portions of alkali to an acid and once portions of a solid. The three marks of the explanation: the temperature rises steadily as more alkali is added; the peak (where the two straight lines cross) is the volume at which the acid is completely neutralised; beyond it the temperature falls because no further reaction happens and the added solution is cool. The maximum read off the graph is accepted within a small range.
For the solid version, the reaction is complete when the temperature stops changing (the last readings are the same), and the likely cause of an anomalous point is not stirring or reading the thermometer too soon; "adding too little solid" is rejected.
- Plot ΔT (y-axis) against volume of HCl added (x-axis) and draw a smooth curve
- The peak of the graph indicates the volume of HCl at which the largest temperature rise occurs — for equal concentrations of acid and alkali this should be at 1 : 1 stoichiometry (25 cm³ in this example)
- Past the peak, additional acid cools the mixture relative to the maximum because the extra acid is not warming up further but is mixing in at room temperature