Energetics
Physical Chemistry · 3 question types
What an energy level diagram shows
- An (sometimes called a reaction profile in later topics) plots the chemical energy of the species on the y-axis against the progress of reaction on the x-axis
- A flat horizontal line at the left marks the energy of the reactants
- A second flat horizontal line at the right marks the energy of the products
- A vertical arrow between the two lines indicates the , ΔH
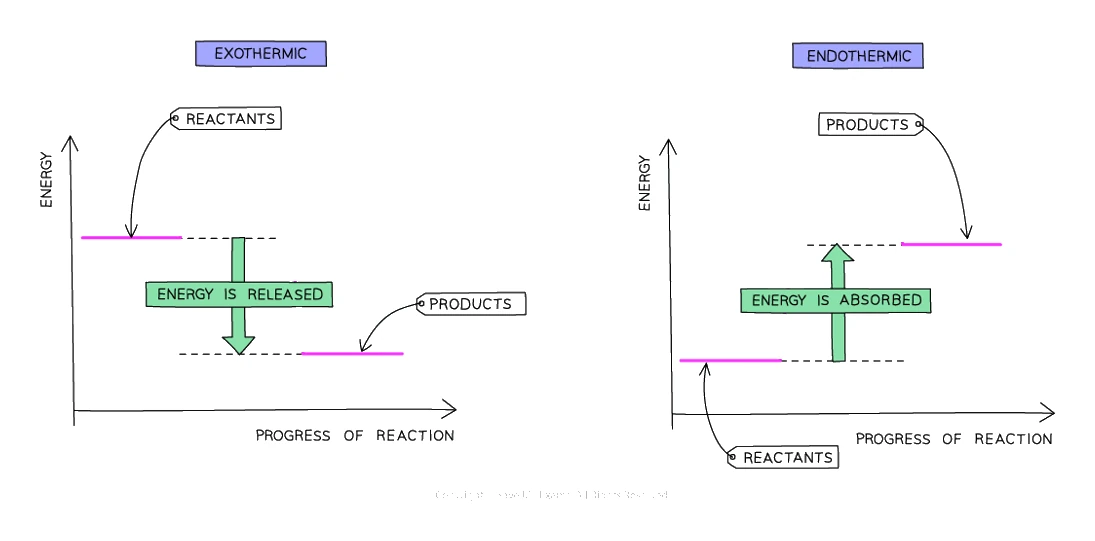
Reading the two cases
| Diagram | Reactant level vs product level | Arrow direction | Sign of ΔH |
|---|---|---|---|
| Exothermic | Reactants higher than products | Arrow points down | ΔH negative |
| Endothermic | Reactants lower than products | Arrow points up | ΔH positive |
- The vertical gap between the two lines IS the magnitude of ΔH; longer arrows mean larger energy changes
Drawing and labelling an energy level diagram
What comes up: draw or complete a reaction profile for an exothermic or endothermic reaction, with correct labels.
Write (four marks): (1) draw a horizontal line for the reactants and a second horizontal line for the products, with the products line at a lower level than the reactants for an exothermic reaction (or higher for endothermic); (2) label each line with the correct formula or name; (3) draw a vertical arrow between the two levels, pointing downward for exothermic, and label it ΔH; (4) draw a curved hump rising from the reactants level and add a vertical arrow from the reactants level up to the peak of the hump, labelled activation energy or Ea.
Watch out: the ΔH arrow must point from the reactants level to the products level — an arrow pointing the wrong way (from products up to reactants, or from the peak down to reactants) is rejected. The mark scheme also rejects an Ea arrow that points downward from the hump to the reactants line.