Exam Frequency Analysis
Past paper frequency (2018 to 2024)
This topic accounts for approximately 20% of your exam marks.
stable
Very High
Stable20%
Photosynthesis equation, limiting factors, and leaf adaptations are tested on almost every paper.
A is something whose shortage slows down a process. In photosynthesis, the rate is set by whichever of the necessary inputs is in the shortest supply at that moment. Provide more of that factor and the rate climbs; the moment a different factor runs short, that one becomes the new limiting factor.
The three main limiting factors are:
- Light intensity
- Carbon dioxide concentration
- Temperature
A fourth factor, availability (broadly, the number of chloroplasts in the leaf), can also limit the rate in specific situations.
Note: water is technically required for photosynthesis, but plants almost never run short of it for the reaction itself, because they lose far more water through transpiration than they use in photosynthesis. So water is not usually counted as a limiting factor.
Light intensity
- The brighter the light, the more energy chlorophyll can absorb, so the faster photosynthesis can run.
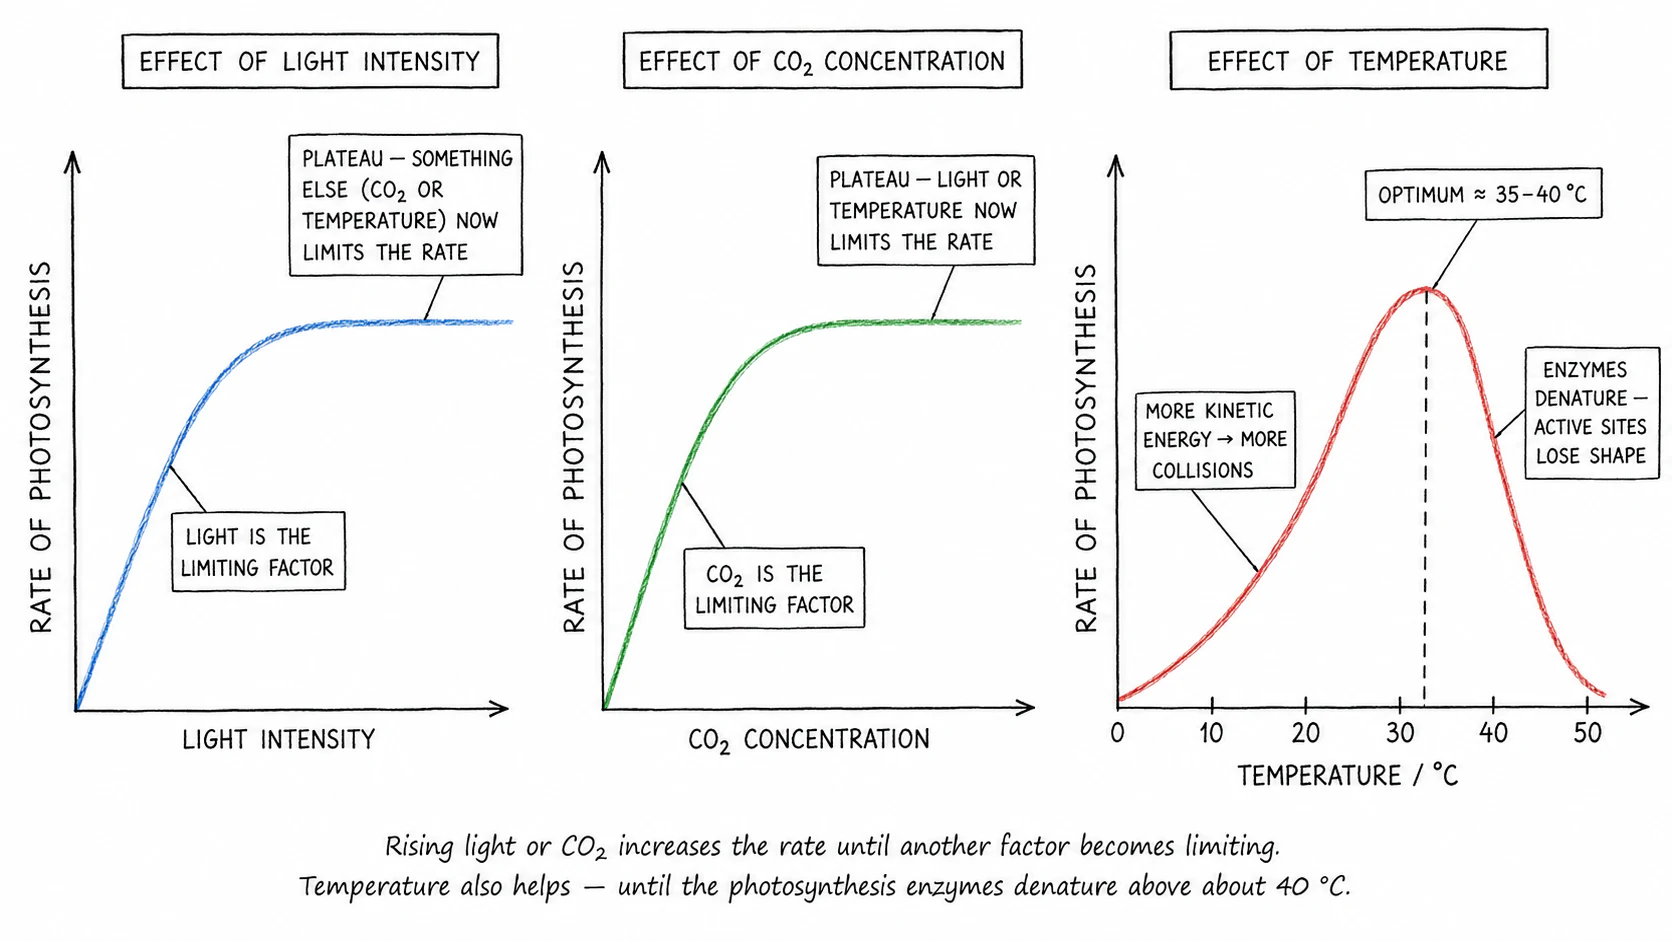
- Plotting rate against light intensity gives a curve that rises steeply at first, then levels off when something else (CO₂ or temperature) becomes the bottleneck.
- In a greenhouse, growers fit artificial lights to keep the rate high in winter and at night.
Carbon dioxide concentration
- Atmospheric air is only about 0.04 % CO₂, so CO₂ is often the bottleneck for plants growing in still air.
- Increasing the CO₂ around a plant boosts the rate of photosynthesis, until light or temperature catches up and becomes the new limit.
- Commercial greenhouses sometimes pump in extra CO₂ (often from burning fuel) to push the rate up further.
Temperature
- All of the chemical reactions inside the chloroplast are controlled by enzymes.
- As temperature rises, the enzymes work faster (more kinetic energy, more successful collisions), so the rate of photosynthesis rises with temperature.
- Above an optimum of about 30–40 °C, the enzymes start to denature: their active sites change shape, and the rate crashes.
- This is why a graph of rate vs temperature for photosynthesis has the same peaked shape as for any enzyme-controlled process.
Exam tip
Explaining the effect of temperature on the rate of photosynthesis
What comes up: explain why the rate of photosynthesis increases as temperature rises, and why it falls at high temperatures (3 marks).
Write (three marks): (1) as temperature increases, the rate of photosynthesis increases; (2) because particles have more kinetic energy, so collisions between substrate and enzyme molecules are more frequent, forming more enzyme-substrate complexes; (3) above the optimum temperature, enzymes denature — their active sites change shape — so the rate falls sharply.
Watch out: you must link temperature to enzyme activity to gain the marks, not just say "it gets faster". The mark scheme specifically requires reference to kinetic energy or collision frequency; a vague "enzymes work better" will not score mark 2.
Chlorophyll availability
- The more chloroplasts a leaf has, the more light it can absorb and the higher the maximum rate of photosynthesis.
- Chlorophyll content can be reduced by:
- Loss of leaves (e.g. in autumn, or due to disease)
- Tobacco mosaic virus and other plant diseases that destroy chloroplasts
- Magnesium deficiency in the soil (magnesium is part of every chlorophyll molecule, so without enough magnesium, the plant cannot make enough chlorophyll)
- leaves, where some patches genuinely contain no chlorophyll at all
Reading a limiting-factor graph
A common exam question gives a graph that levels off at some maximum rate and asks what the limiting factor is:
- If the x-axis is the factor you are changing (e.g. light intensity), then in the section where the line is , light intensity is the limiting factor.
Exam tip
Explaining why the rate of photosynthesis stops increasing (the plateau)
What comes up: a graph of rate of photosynthesis against light intensity (or CO₂) levels off at high values; the question asks you to explain the shape at the plateau (2 marks).
Write (two marks): (1) the rate no longer changes as light intensity increases; (2) because light is no longer the limiting factor — another factor such as carbon dioxide concentration or temperature is now limiting the rate.
Watch out: at the flat section of the graph, do NOT say "light is the limiting factor" — the mark scheme specifically gives no credit for that. The whole point is that on the plateau, light is no longer limiting and you must name a different factor that is.