Sound
Waves
What an oscilloscope shows
- An oscilloscope is an instrument that draws a graph of a rapidly changing voltage against time
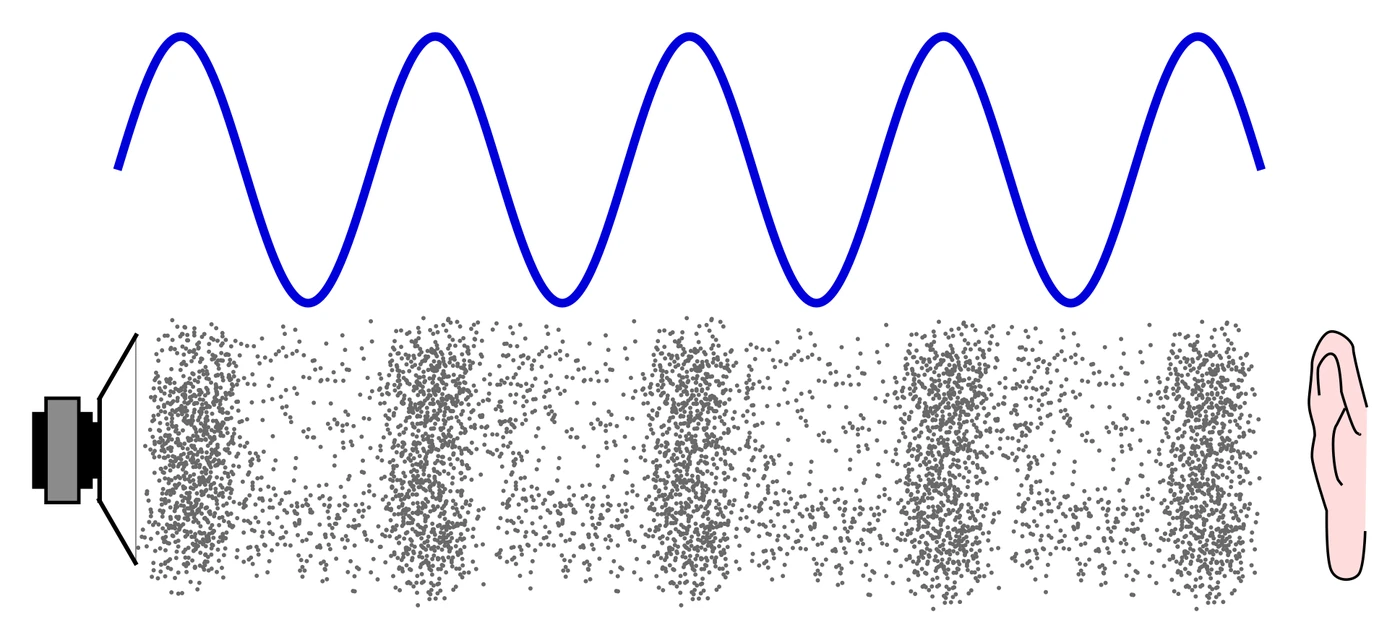
- A microphone converts the longitudinal vibration of air into a varying voltage, so connecting a microphone to an oscilloscope lets you "see" a sound wave on the screen
- The displayed trace looks like a transverse wave, even though the underlying sound is longitudinal, because the screen is plotting voltage (y) against time (x), not the back-and-forth motion of air particles
Common exam question
Naming the detector connected to the oscilloscope
Question: Give the name of the equipment that detects the sound wave for the oscilloscope (1 mark).
Asked in 3 of the 24 papers, always ahead of the parts that read the trace. The answer is microphone: it converts the pressure variations of the sound into a varying voltage, which is what the oscilloscope plots. One scheme lists "sound sensor" and "ultrasound detector" as ignored, so on their own they earn nothing, even when the wave being detected is ultrasound.
Reading the trace
- The time base sets the x-axis: how many milliseconds (or microseconds) correspond to each horizontal division on the screen
- The y-gain sets the y-axis: how many millivolts correspond to each vertical division
- Two quantities are read directly off a frozen trace:
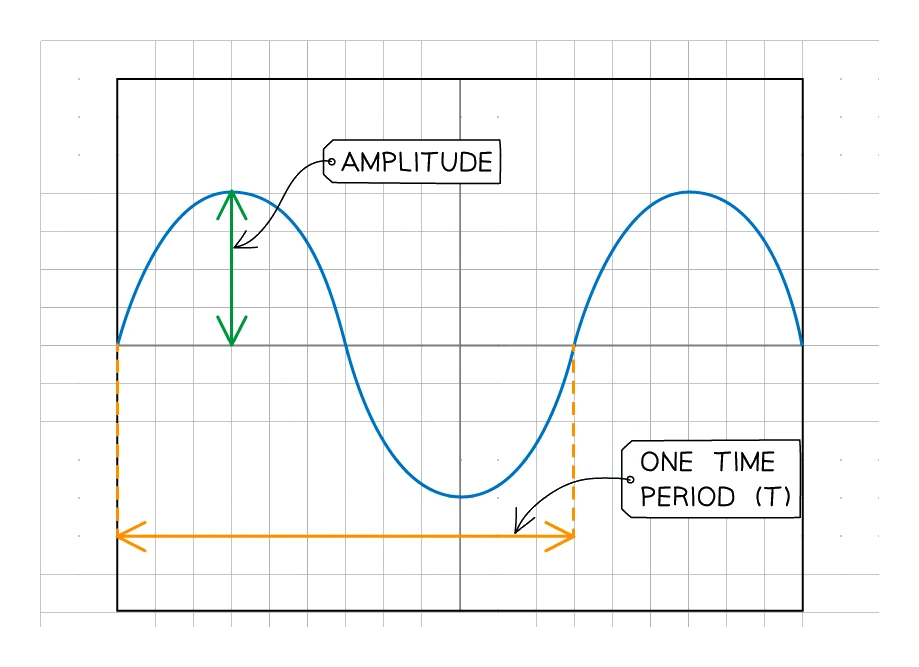
- Amplitude: the vertical height of a peak measured from the centre line; a louder sound gives a taller trace
- Period (T): the horizontal distance between two corresponding points on the wave (peak to peak is easiest); a higher-pitched sound gives a shorter horizontal gap
- Once T is known, the of the sound is f = 1 / T
- A higher-frequency sound fits more wave cycles across the same width of screen
Common exam question
Reading the period and frequency off the trace
Question: Use the trace and the oscilloscope settings to determine the time period of the sound wave, then calculate its frequency (3–5 marks in total).
Asked in 4 of the 24 papers. The first mark is the number of squares for one full cycle, read along the time axis; an answer that clearly uses the amplitude scale scores zero. Measure across all the cycles shown and divide, which is how two of the schemes find the period: one accepts 5.2 to 5.5 squares, another caps a slightly short reading at three of its four marks. The second mark is multiplying by the time base (the time per square), and a wrong square count still earns it if the working is clear. Give the period in seconds, converting from milliseconds. Then f = 1/T earns the remaining mark or marks with error carried forward from your period. A power-of-ten slip costs one mark.
Worked example
Finding frequency from an oscilloscope trace
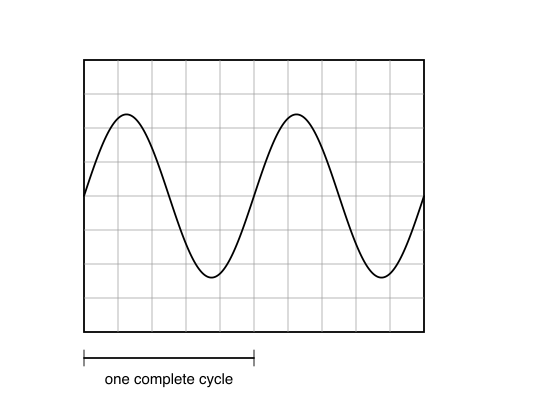
A sound wave is displayed on an oscilloscope. One full cycle spans 5 squares horizontally, and the time-base is set to 2 ms per division.
Solution:
- Period: T = 5 × 2 ms = 10 ms = 0.010 s
- Frequency: f = 1 / T = 1 / 0.010 = 100 Hz