4PH1
Sound
Waves
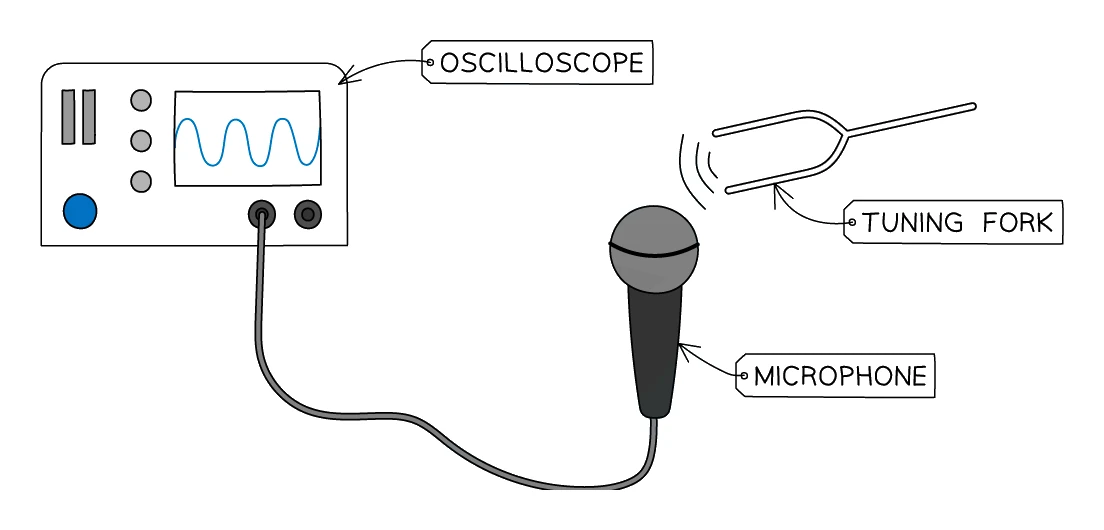
Aim
- Measure the of the sound produced by tuning forks of different pitches by reading the period off an oscilloscope screen
Variables
- Independent variable: the tuning fork being used (each fork is stamped with its rated frequency)
- Dependent variable: the period T read from the oscilloscope trace (s), from which the measured frequency is calculated
- Control variables: the same microphone and oscilloscope, the same time-base setting (kept constant during one measurement, and noted so it can be converted), the same fork-to-microphone distance, the same quiet room
Equipment
| Equipment | Purpose |
|---|---|
| Several tuning forks of known frequency | Produce a clean tone at the fork's stamped frequency |
| Rubber striking pad | Strike the fork on something soft to avoid metallic ringing overtones |
| Microphone | Pick up the fork's tone and turn it into a varying voltage |
| Oscilloscope | Display the voltage against time and measure its period |
| Connecting leads | Wire the microphone to the oscilloscope's channel-1 input |
Method
- Connect the microphone to channel 1 of the oscilloscope and switch the oscilloscope on
- Set the time base so that a few full cycles of a typical 400–500 Hz fork will fit across the screen (a starting value of around 0.5 ms per division works well)
- Strike the first tuning fork sharply on the rubber pad and immediately hold it about 5 cm from the microphone
- Freeze the oscilloscope display, or take a quick photograph of the screen, while the trace is steady
- Read off how many horizontal divisions make up one full cycle of the wave by tracking from a peak to the next peak (this gives the cleanest reading)
- Repeat the strike-and-freeze cycle a further two times for the same fork; take the average number of divisions
- Repeat steps 3–6 for the other forks, adjusting the time base if the higher-frequency forks pack too many cycles into the screen
Analysis
- Convert divisions to seconds using the time base:
T = (divisions per cycle) × (time-base scale per division)
- Convert period to frequency:
f = 1 / T
- Compare the measured frequency with the value stamped on the side of the fork
Sources of error and safety
- Systematic error, wrong time-base reading. The scale on most oscilloscopes is in milliseconds per division; misreading it as seconds per division throws the answer out by a factor of 1000. Always note the scale at the start of each measurement
- Random error, background noise. Other sounds in the room add fuzz to the trace and make division-counting harder. Carry the practical out in a quiet room and ask others not to talk while a measurement is being taken
- Safety. Strike the fork on a rubber pad rather than a hard surface; striking glass or concrete can chip the fork and send fragments flying