Exam Frequency Analysis
Past paper frequency (2018 to 2024)
This topic accounts for approximately 12% of your exam marks.
stable
High
Stable12%
Distance-time graphs, speed calculations and velocity appear in nearly every series.
Reading the slope
- A velocity-time graph plots an object's velocity (y-axis) against the time elapsed since the start of the motion (x-axis)
- The slope of the line tells you about the acceleration:
- A straight line with a positive gradient means constant acceleration, with velocity climbing at a steady rate
- A straight line with a negative gradient means constant deceleration, with velocity falling at a steady rate
- A steep line signals a large magnitude of acceleration; a gentle line signals a small one
- A flat horizontal line means zero acceleration, so the velocity stays at a single fixed value (a constant velocity)
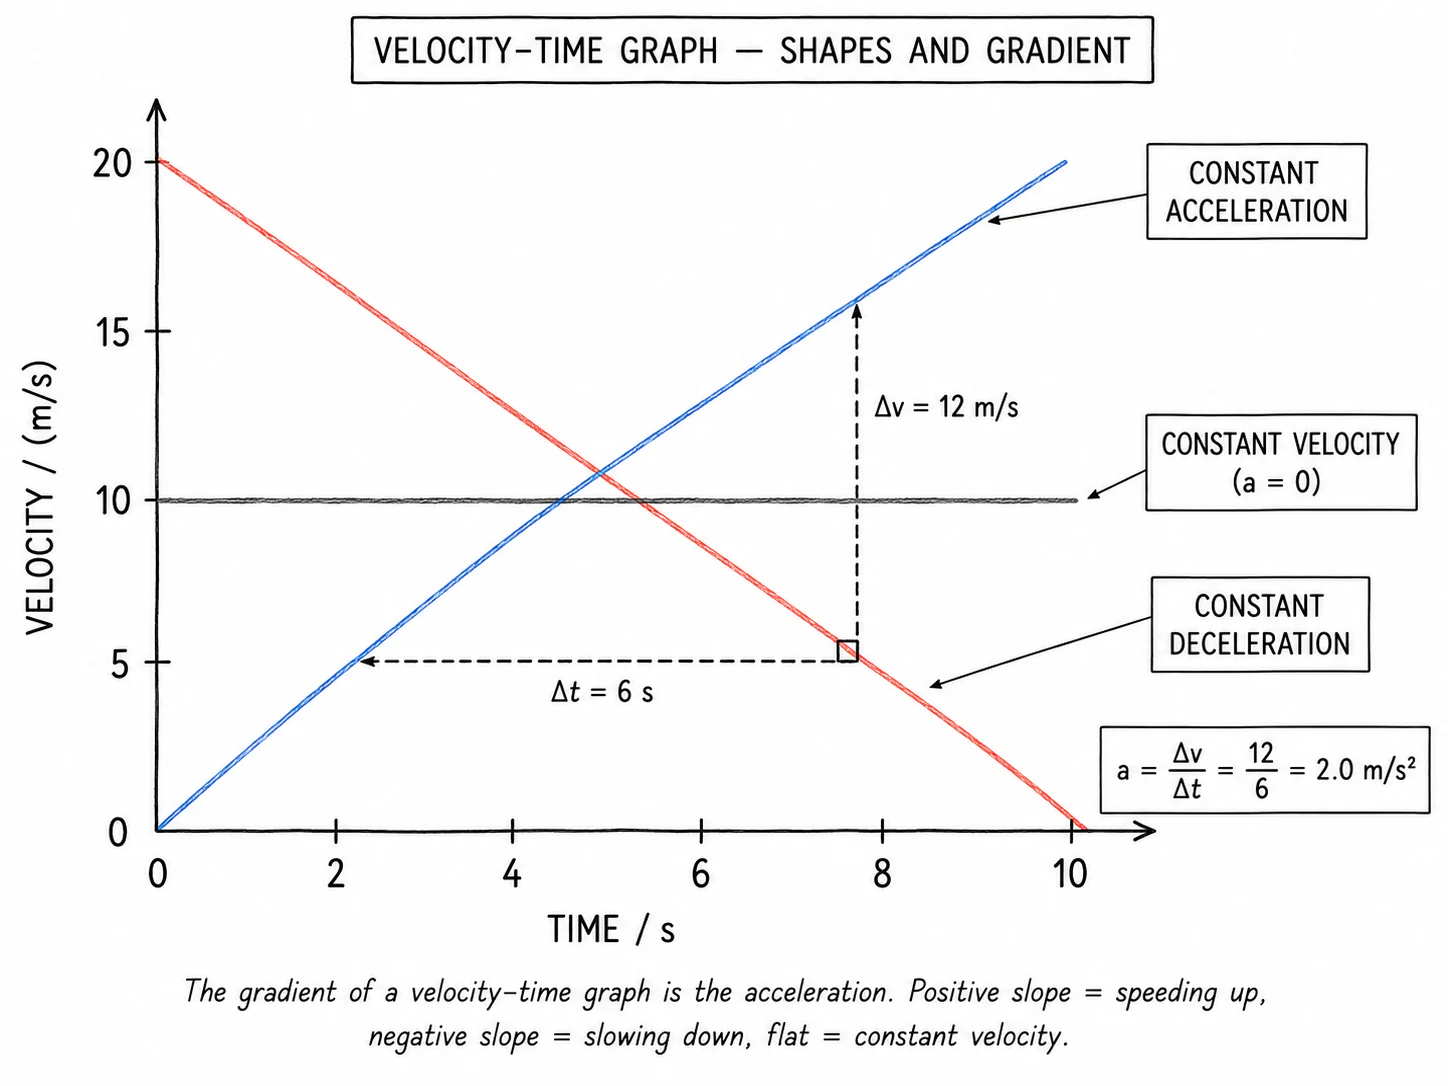
Gradient = acceleration
- The of an object equals the of its velocity-time graph:
a = Δy / Δx = Δv / Δt
- For a straight-line section, the gradient is the same everywhere, so draw a large gradient triangle and divide the rise by the run, taking care to read the axes in their stated units (m/s and s)
Exam tip
Reading a velocity–time graph: gradient and area
What comes up: the exam asks what the gradient of a velocity–time graph represents, or asks you to use the gradient to find acceleration.
Write: acceleration = gradient = (change in velocity) ÷ (change in time). State this explicitly before substituting numbers — the mark scheme awards the first mark for linking acceleration to the gradient.
Watch out: a common slip is to confuse the two graph types: on a distance–time graph the gradient gives speed; on a velocity–time graph the gradient gives acceleration. The area under the line is not acceleration — it is the distance travelled.