4PH1
Movement & Position
Forces & Motion · 1 question type
Exam Frequency Analysis
Past paper frequency (2018 to 2024)
This topic accounts for approximately 12% of your exam marks.
stable
High
Stable12%
Distance-time graphs, speed calculations and velocity appear in nearly every series.
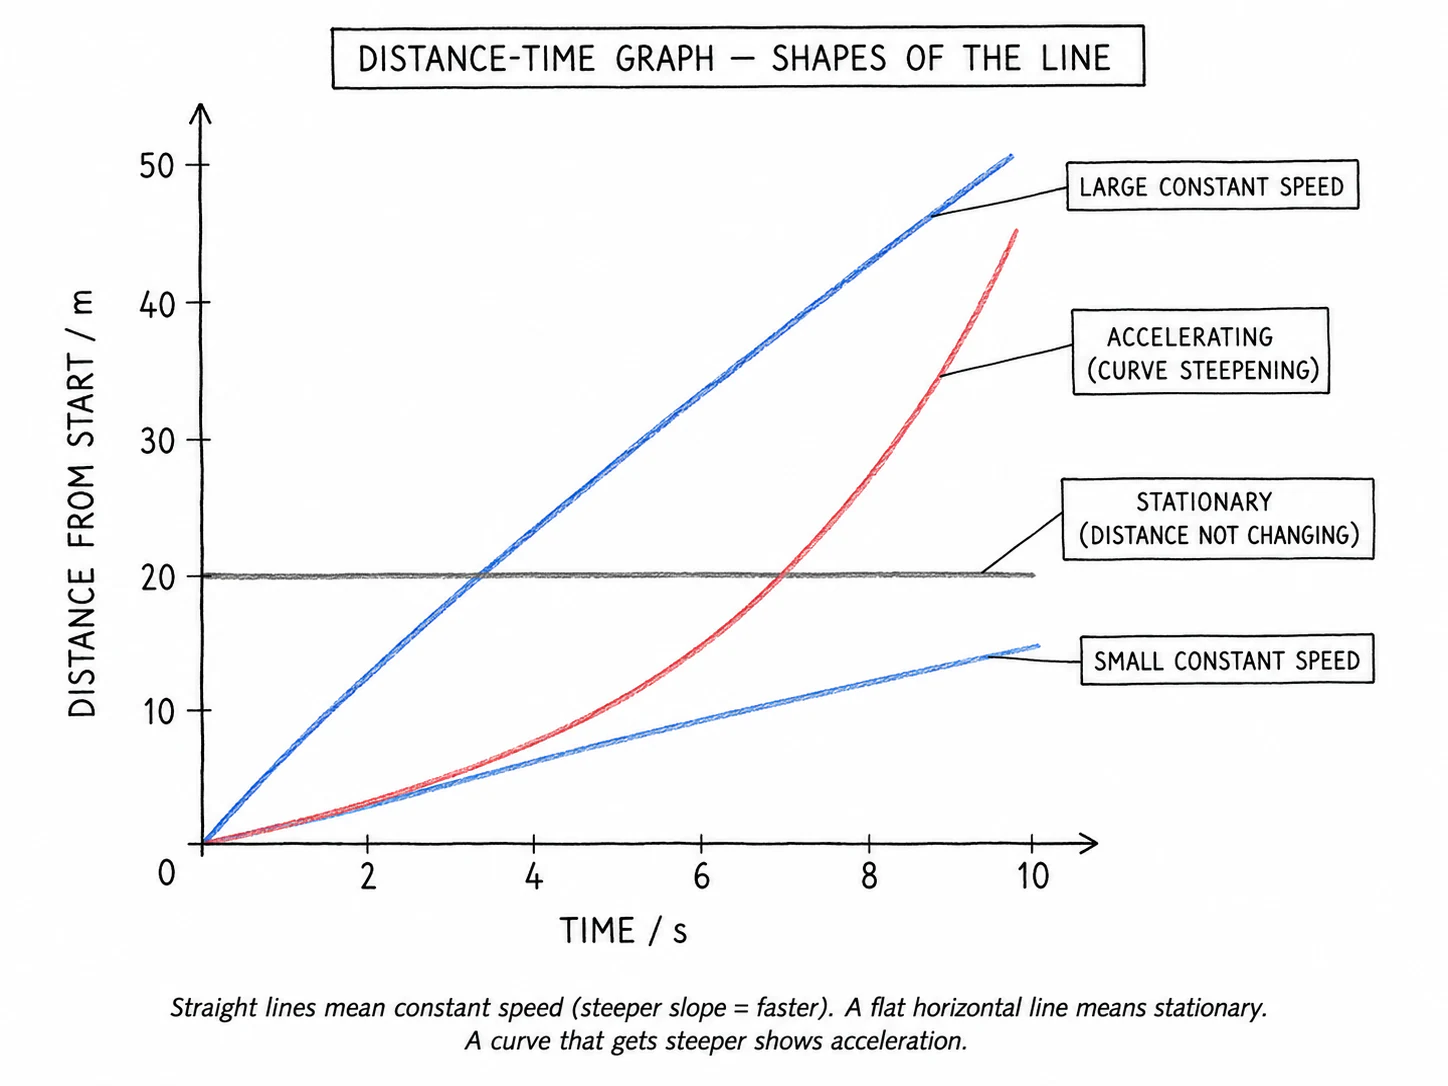
Reading the shape of the line
- A distance-time graph plots the distance an object has travelled from a starting point (y-axis) against the time it has been moving (x-axis)
- The shape of the line tells you how the speed of the object is behaving at any moment
- For a section where the object travels at a constant speed:
- A straight line on the graph is the signature of a fixed speed
- The steeper the line, the faster the constant motion
- A line with only a slight tilt corresponds to a slow, plodding motion
- A perfectly horizontal line signals that the object is at rest, because its distance from the start is not changing
- For a section where the speed is changing:
- A curved line is the signature of a changing speed
- A curve that gets steeper over time means the object is speeding up (accelerating)
- A curve that flattens out over time means the object is slowing down (decelerating)
Calculating speed from the gradient
- The at any point on a distance-time graph equals the of the line at that point:
speed = gradient = Δy / Δx = (change in distance) / (change in time)
- For a straight-line section, the gradient is the same everywhere, so pick two convenient points well apart on the line, read off the change in distance and the change in time, and divide
- For a curved section, the slope keeps changing, so the gradient at one instant is the slope of the tangent at that point
- Drawing a large gradient triangle across the longest available straight section gives the smallest read-off uncertainty, because small triangles magnify the error of each axis reading
Worked example
Calculating speed from a distance–time graph
An object moves along a straight track. On the distance–time graph for the journey, the line rises from 20 m at t = 4 s to 80 m at t = 16 s.
Solution:
- Change in distance: 80 − 20 = 60 m
- Change in time: 16 − 4 = 12 s
- Speed = change in distance ÷ change in time = 60 ÷ 12 = 5 m/s