Movement & Position
Forces & Motion
What the area means
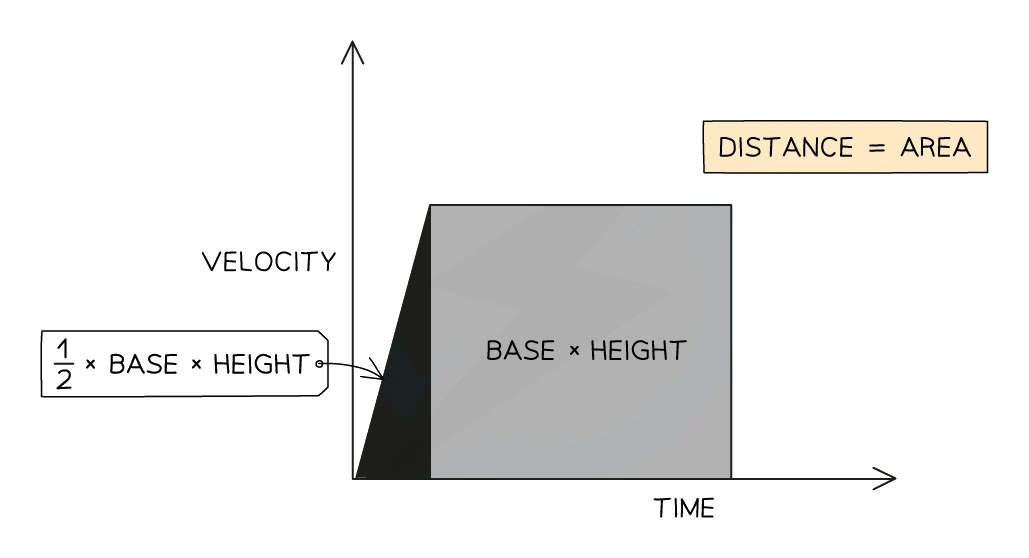
- The area enclosed between a velocity-time line and the time axis equals the distance that has been covered during the interval (or, equivalently, the magnitude of the displacement if the motion runs in a single direction)
- This is true because area = velocity × time on every thin vertical strip under the line, and velocity × time = distance moved in that strip
Splitting a multi-stage motion into shapes
- A constant-velocity section is a horizontal line, so the area under it is a rectangle:
rectangle area = base × height
- A section of constant acceleration or deceleration is a straight slope, so the area under it (down to the time axis) is a triangle:
triangle area = ½ × base × height
- A section that combines a non-zero starting velocity with an acceleration gives a trapezium; split it into a rectangle and a triangle and add the two
- The total distance for a multi-stage motion is found by adding together the area of every enclosed region one stage at a time
Common exam question
Distance from the area under a velocity–time graph
Question: Calculate the distance travelled, or the braking distance, over a stated interval of a velocity–time graph, or show that it has a given value (3–5 marks).
Asked in 6 of the 24 papers. The first mark is for the idea that distance = area under the line, stated or implied by your working. The method marks are then the shapes: a triangle (½ × base × height) under a sloping section and a rectangle under a flat one, added together; for a curve, count the squares or split the area into trapeziums, and the answer is accepted within a range.
Take the area only over the interval asked for. A braking distance is the triangle under the deceleration alone: adding the rectangle for the reaction time gives the whole stopping distance and lost a mark. Using v² = u² + 2as with the acceleration from the earlier part is accepted as an alternative, with follow-through on that value.
Worked example
Finding distance from the area under a velocity–time graph
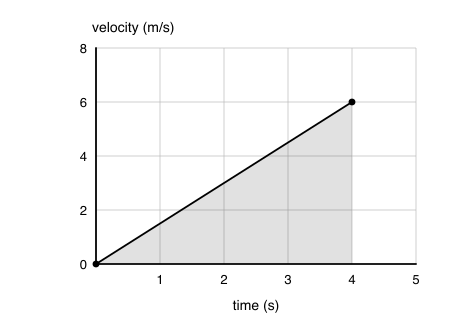
A velocity–time graph shows an object accelerating uniformly from rest (0 m/s) to 6.0 m/s over 4.0 s, then the recording stops.
Solution:
- The region under the line is a triangle (straight slope from zero)
- Area of triangle = ½ × base × height = ½ × 4.0 × 6.0
- Distance = 12 m