MathematicsExam code: 0580
Histograms
Statistics
What Makes a Histogram Different
Area, not height
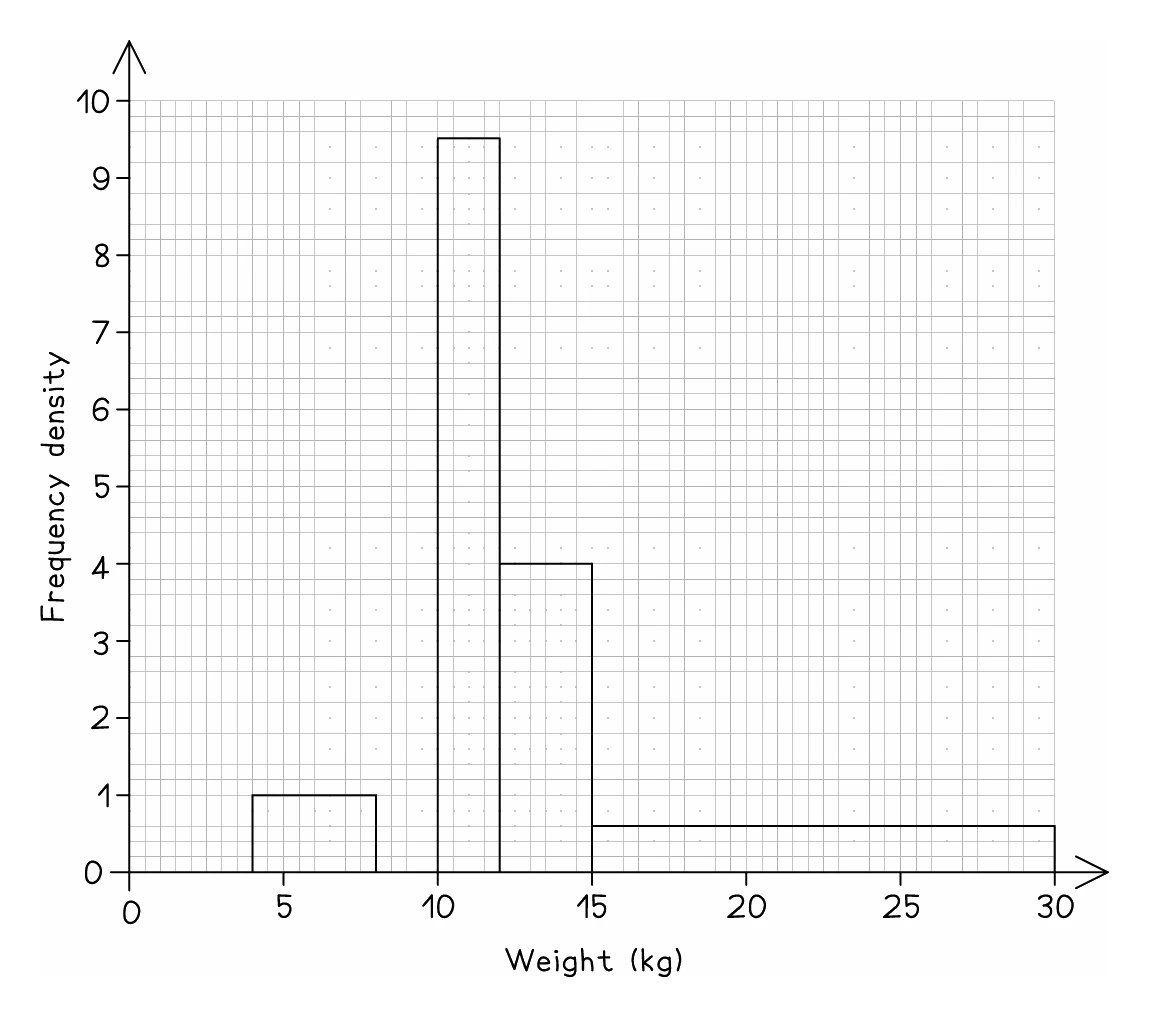
- A histogram displays grouped continuous data, usually in class intervals of unequal width
- It looks like a bar chart but behaves differently in two ways that decide every question
- The bars touch, with no gaps, because the data is continuous
- The area of a bar gives the frequency, not its height
- The vertical axis is labelled frequency density, which the syllabus states directly
- Because area carries the meaning, a histogram cannot be read at a glance the way a bar chart can: some calculation is always needed
| Bar chart | Histogram | |
|---|---|---|
| Data | discrete or categorical | continuous, grouped |
| Class widths | equal | usually unequal |
| Bars | separated by gaps | touching |
| Vertical axis | frequency | frequency density |
| Frequency shown by | the height | the area |
- Where every class happens to be the same width, the heights are in proportion to the frequencies, but the syllabus still labels the vertical axis frequency density