MathematicsExam code: 0580
Histograms
Statistics
From a table
- Work out every frequency density before touching the graph
- Draw each bar with its width along the horizontal axis and its height equal to the frequency density
- The bars sit edge to edge with no gaps
- Questions usually give a partly-drawn histogram and ask you to complete it, rather than starting from blank axes
- Read the scale on the frequency density axis carefully, since one square is rarely one unit
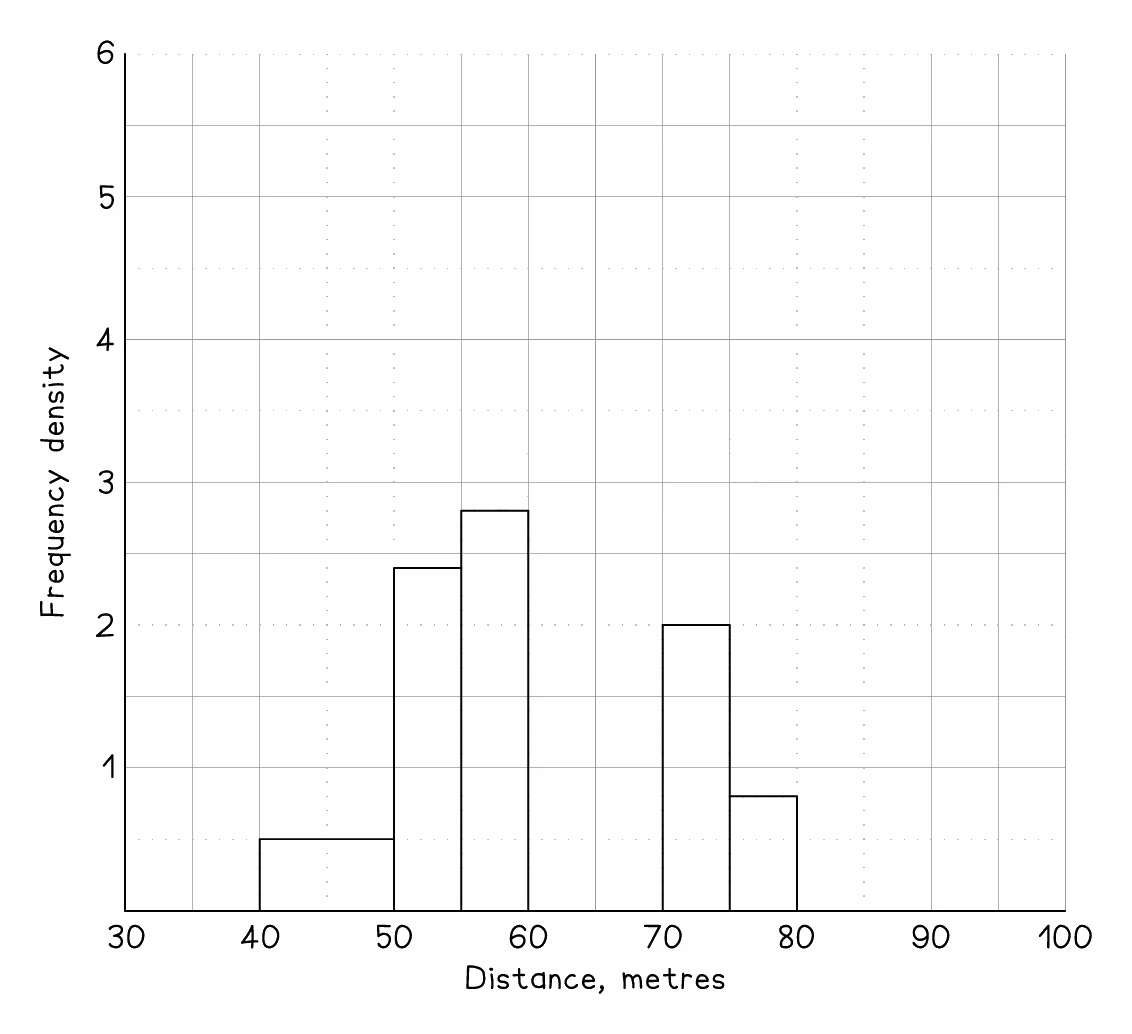
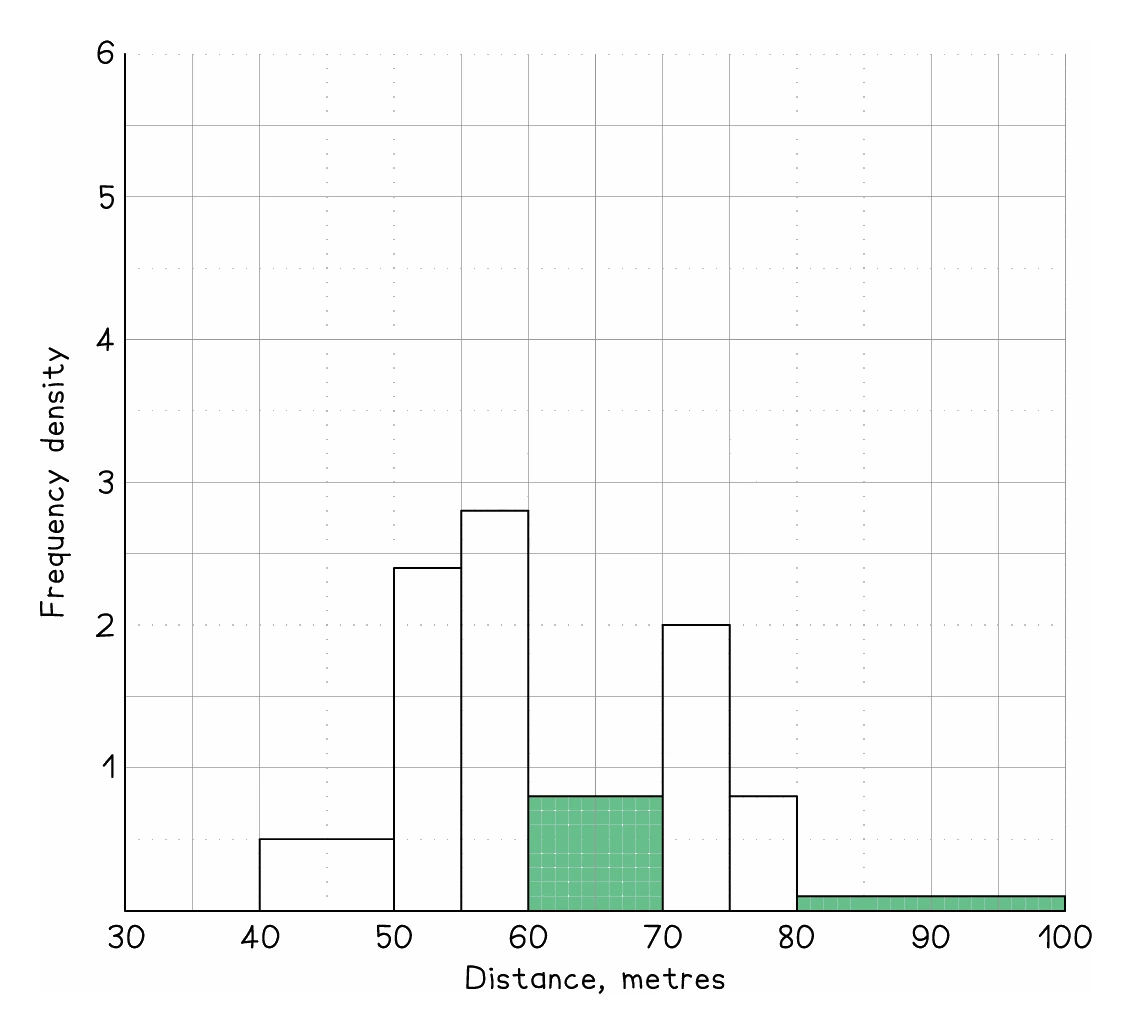
Worked example
Completing a histogram
The table shows the times, t minutes, taken by 75 runners to finish a fun run. On a histogram of this data, the bar for 20 < t ⩽ 30 is already drawn at a frequency density of 1.2. Complete the histogram.
| Time (t minutes) | 20 < t ⩽ 30 | 30 < t ⩽ 35 | 35 < t ⩽ 45 | 45 < t ⩽ 60 |
|---|---|---|---|---|
| Frequency | 12 | 21 | 30 | 12 |
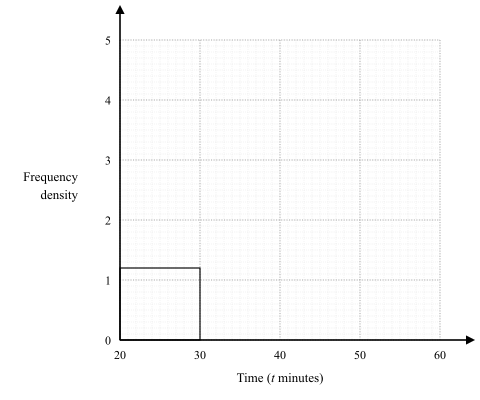
Solution:
- Check the bar already drawn first: 12 ÷ 10 = 1.2, which matches its height
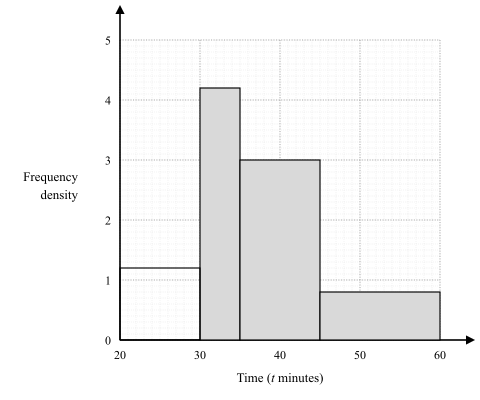
- 30 < t ⩽ 35 has width 5, so its frequency density is 21 ÷ 5 = 4.2
- 35 < t ⩽ 45 has width 10, so its frequency density is 30 ÷ 10 = 3
- 45 < t ⩽ 60 has width 15, so its frequency density is 12 ÷ 15 = 0.8
- Draw the three bars edge to edge: from 30 to 35 at height 4.2, from 35 to 45 at height 3 and from 45 to 60 at height 0.8
- With 10 small squares to each unit of frequency density, the top of the first new bar is 2 small squares above the 4 line, and the top of the last is 8 small squares above zero
Exam tip
Show every frequency density before you draw
Drawing a histogram or finding its bar heights in centimetres is set in 8 of the 21 papers. Write each frequency density (frequency ÷ class width) in your working before you draw or scale anything. The marks go on correct bars or heights, but if none of yours is right, every one of those schemes still gives a mark for correct frequency densities, so leave them where the examiner can see them.
When no frequency density scale is given
- A variant gives the height of one bar in centimetres and asks for the heights of the others
- Heights are proportional to frequency density, so find the scale from the bar you are given, then apply it
- If a class with frequency density 3.5 is drawn 7 cm tall, then 1 unit of frequency density is 2 cm
- A class with frequency density 1.2 is then drawn 2 × 1.2 = 2.4 cm tall
- The method is identical; only the units on the vertical axis change