MathematicsExam code: 0580
Histograms
Statistics
Back to frequencies
- Going the other way, multiply each bar's frequency density by its class width to recover the frequency
- A question gives the histogram and asks for the frequency of a class, sometimes by filling in a table
- Add the frequencies to find the total number of items where the question needs it
Part of a bar
- Where a question asks about only part of a class, take the matching part of that bar's area
- The frequency density is constant across the bar, so the frequency for part of it is that frequency density times the part-width
- This assumes the data is spread evenly through the class, which is why the answer is an estimate
Worked example
Reading frequencies off a histogram
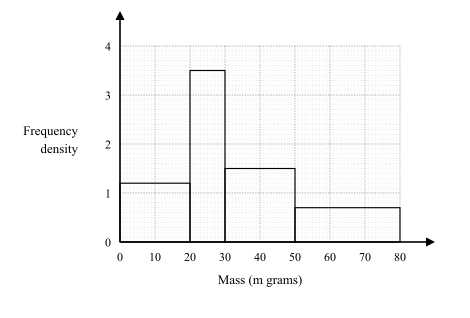
The histogram shows the masses of the 110 items from the first worked example in this note. Find the frequency for the class 20 < m ⩽ 30, and estimate how many items have a mass between 30 g and 40 g.
Solution:
- For the whole class, frequency = frequency density × class width
- The bar for 20 < m ⩽ 30 has frequency density 3.5 and width 10
- Frequency = 3.5 × 10 = 35 items, matching the original table
- For 30 g to 40 g, this is part of the class 30 < m ⩽ 50, whose frequency density is 1.5
- The part-width is 40 − 30 = 10
- Estimated frequency = 1.5 × 10 = 15 items
- This is an estimate because it assumes the 30 items in that class are spread evenly across its full width of 20
Comparing two histograms
- Two histograms can be compared by eye only when both use frequency density on the same vertical scale
- Otherwise read the frequency densities off each one, using its own scale, before comparing them