Cumulative Frequency
Statistics
Median, quartiles and percentiles
- Everything read off a cumulative frequency diagram is an estimate, because the original values are unknown
- Find the total, n, from the highest point the curve reaches, at the top right
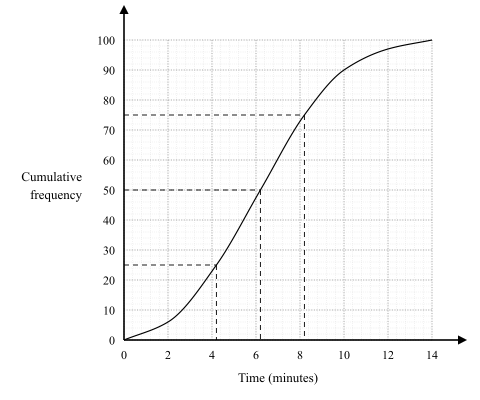
- Then work from the cumulative frequency axis across to the curve and down to the horizontal axis
| Statistic | Position on the cumulative frequency axis |
|---|---|
| Lower quartile | n ÷ 4 |
| Median | n ÷ 2 |
| Upper quartile | 3n ÷ 4 |
| p-th percentile | p ÷ 100 × n |
- Note that the median position here is n ÷ 2, not (n + 1) ÷ 2 as it is for a list of values, because the curve treats the data as spread smoothly
- The interquartile range is the upper quartile minus the lower quartile, both read off in the same way
- Draw the horizontal and vertical lines on the diagram, since they show where the reading came from
Exam tip
Write down both quartiles before you subtract
An interquartile-range question gives a mark for one correct quartile on its own, whether you read the quartiles off a curve or find them from a list. So write each one down as you get it (lower quartile = …, upper quartile = …) and only then subtract. A misreading of the other quartile, or a slip in the subtraction, still leaves you that mark.
Worked example
Quartiles from a cumulative frequency diagram
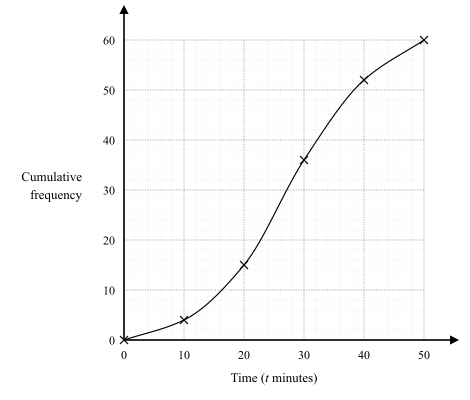
The table in section 1 records the times of 60 people, and a smooth cumulative frequency curve is drawn through its points. Use the curve to estimate the median, the quartiles and the interquartile range.
Solution:
- The total is n = 60, which is where the curve finishes at the top right
- The lower quartile is at 60 ÷ 4 = 15 on the cumulative frequency axis
- The median is at 60 ÷ 2 = 30
- The upper quartile is at 3 × 60 ÷ 4 = 45
- For each one, draw a horizontal line from that value across to the curve, then a vertical line down to the time axis and read the value
- The cumulative frequency reaches 15 exactly at the end of the second class, so the lower quartile is 20 minutes
- The reading for 30 falls between 20 and 30 minutes, giving a median of roughly 27 minutes
- The reading for 45 falls between 30 and 40 minutes, giving an upper quartile of roughly 35 minutes
- Interquartile range = upper quartile − lower quartile, so about 35 − 20 = 15 minutes
How many are above or below a value
- To find how many are below a given value, go up from that value on the horizontal axis to the curve, then across to read the cumulative frequency
- To find how many are above it instead, subtract that reading from the total
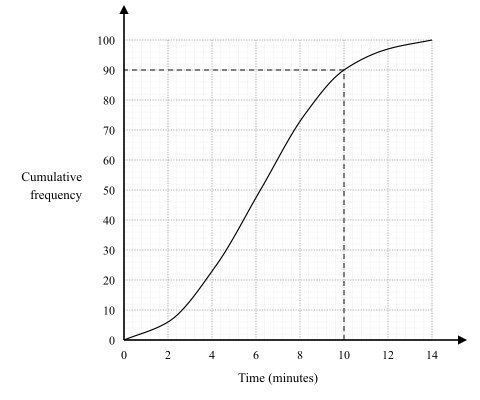
- Read the question carefully: "more than", "at least" and "fewer than" all need the same reading, but only "fewer than" is answered by the reading itself; for "more than" or "at least", subtract the reading from the total
Worked example
How many took longer than a given time
Using the same curve for 60 people, estimate how many took longer than 35 minutes.
Solution:
- Start at 35 on the horizontal time axis and go straight up to the curve
- Now read horizontally to the vertical scale and note the running total there
- 35 minutes is halfway between the plotted points (30, 36) and (40, 52), but the curve is starting to level off there, so it reads a little above the halfway value of 44: about 45
- That means about 45 people took 35 minutes or less
- The question asks for longer than 35 minutes, so subtract from the total
- 60 − 45 = about 15 people
- Always check whether the question wants the reading itself or the total minus the reading