MathematicsExam code: 0580
Cumulative Frequency
Statistics
Plotting at the upper bound
- The single most important rule: each running total goes above the upper bound of its class, never above the midpoint
- The reason is that only at the end of a class can every value in it be guaranteed to have been counted
- So the table above gives the points (10, 4), (20, 15), (30, 36), (40, 52) and (50, 60)
- Add a starting point at the lower bound of the first class with a cumulative frequency of zero, here (0, 0)
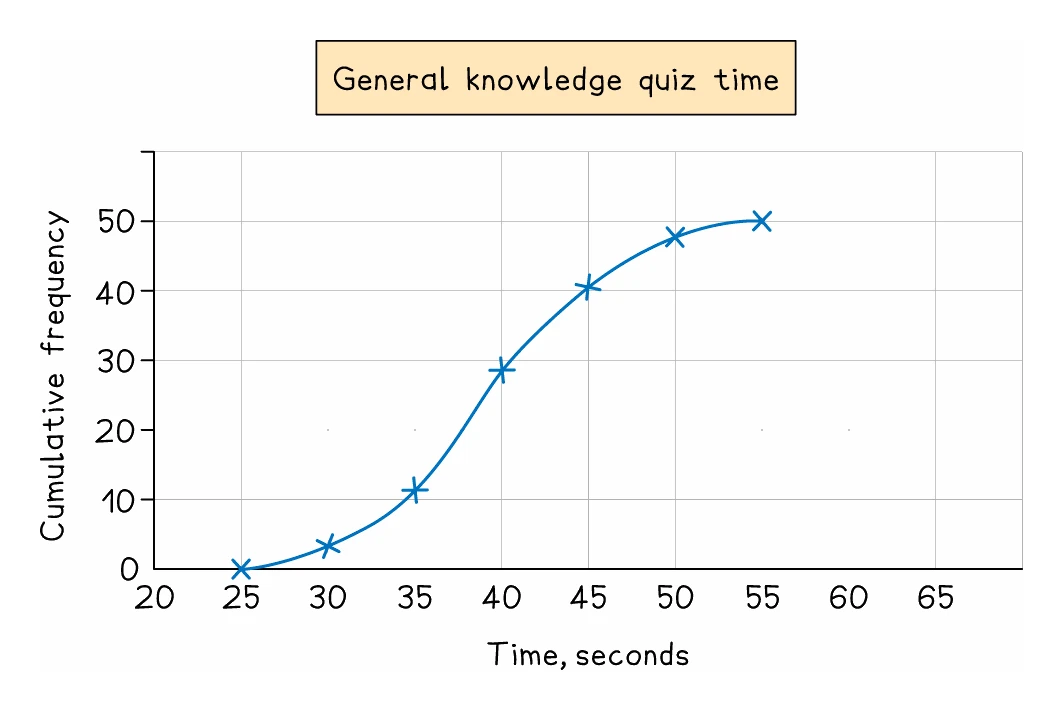
- The syllabus asks for points to be clearly marked, for example as small crosses, and joined with a smooth curve
- The curve usually has a stretched S-shape, rising steeply where the frequencies are largest, and it never turns back down