Workers & Wages
Microeconomic Decision Makers · 4 question types
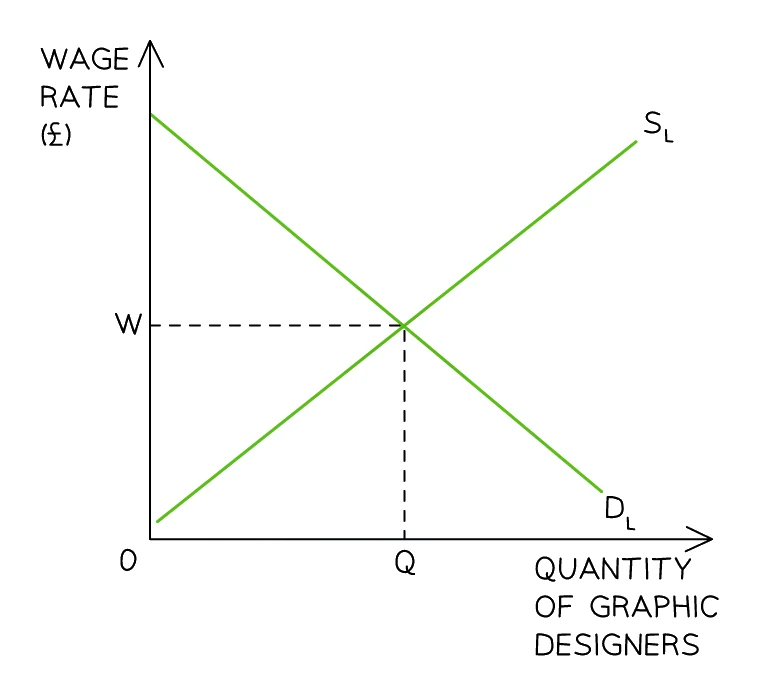
The labour market is the market in which workers (the suppliers of labour) meet firms (the buyers of labour). The "price" in this market is the ; the "quantity" is the number of workers employed (or hours worked).
Like every other market on the syllabus, the labour market has demand and supply curves. Where they cross sets the at which the quantity of labour demanded equals the quantity supplied.
Two features make the labour market different from a product market:
- Demand for labour is . Firms do not want workers for their own sake; they want the products workers help to make. When demand for a firm's product rises, its demand for labour rises with it.
- The supply of labour is the number of workers willing and able to work at each wage. It tends to rise as the wage rises, because higher pay attracts more workers and persuades some to work extra hours.
A standard labour-market diagram has the wage rate on the vertical axis, the quantity of labour on the horizontal axis, a downward-sloping DL (demand for labour) curve and an upward-sloping SL (supply of labour) curve. They cross at the equilibrium wage W and quantity Q.