MathematicsExam code: 0580
Statistical Diagrams
Statistics
Bar charts
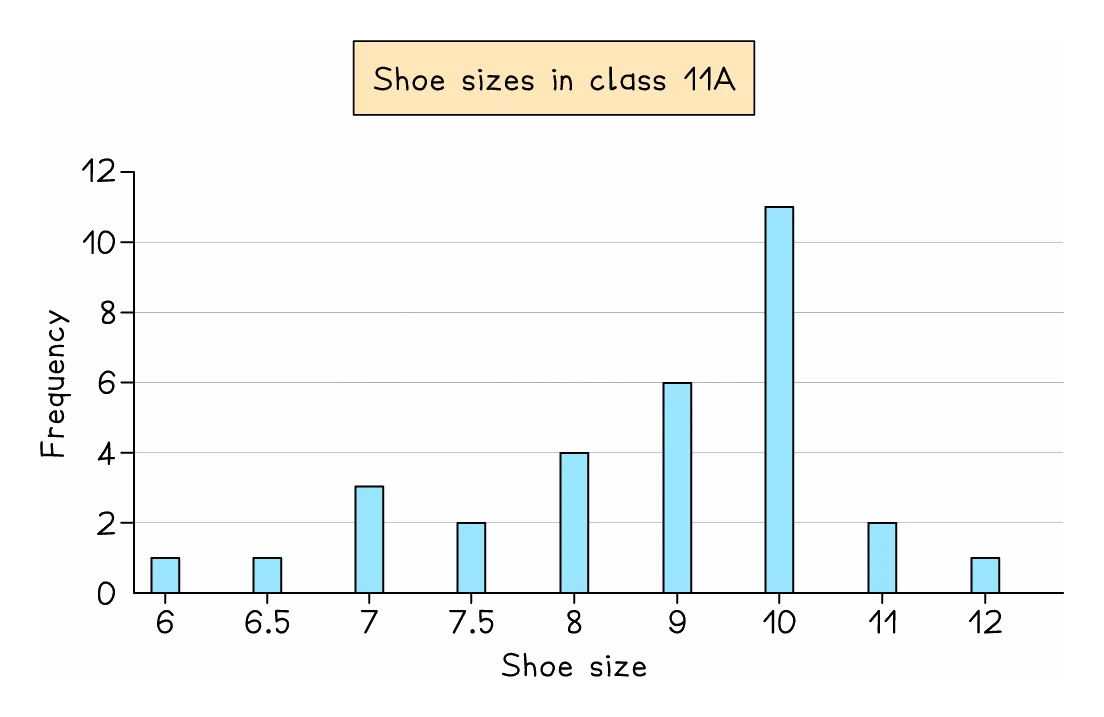
- A bar chart shows discrete or categorical data, with the categories along the bottom and the frequency up the side
- Bars are drawn with equal widths and with gaps between them, which is what distinguishes a bar chart from a histogram
- The tallest bar gives the mode
- The syllabus names two variants
- A dual bar chart puts the bars for two data sets side by side for each category
- A composite or stacked bar chart stacks the parts of each bar on top of one another, so the total height is the combined frequency, or 100% when each bar shows percentages
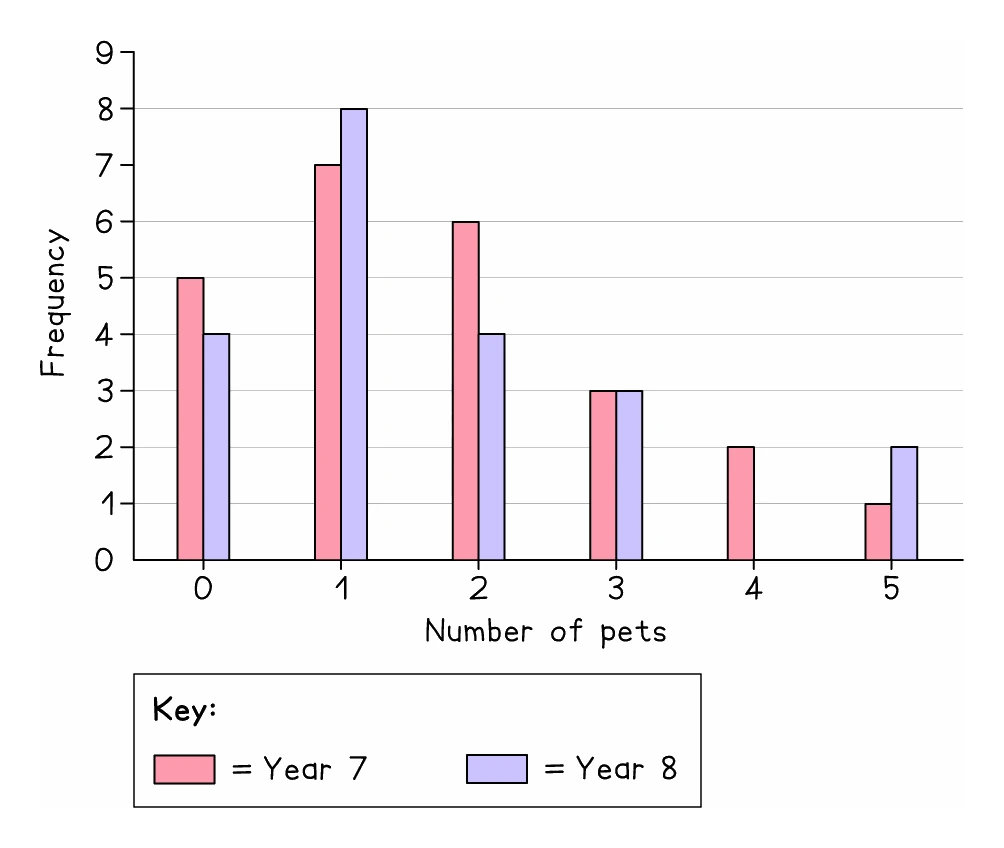
- When drawing one, pick a scale from the largest frequency so that it fits the space given
Worked example
Reading a composite bar chart
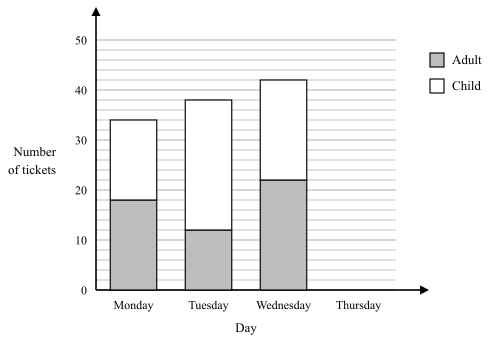
A cinema sells adult and child tickets. The composite bar chart shows how many of each it sold on Monday, Tuesday and Wednesday, with the adult part at the bottom of each bar. (a) On which day were the most child tickets sold? (b) On Thursday the cinema sold 40 tickets, and 16 of them were adult tickets. Draw the bar for Thursday.
Solution:
- Each part of a bar starts where the part below it ends, so its value is the reading at its top minus the reading at its bottom
- (a) Child tickets: Monday 34 − 18 = 16, Tuesday 38 − 12 = 26, Wednesday 42 − 22 = 20
- The most child tickets were sold on Tuesday, with 26
- Wednesday has the tallest bar, but its height of 42 is both parts together, not the child tickets alone
- (b) Draw a bar as wide as the others, shaded like the key's adult square from 0 up to 16, then unshaded from 16 up to 40 for the 24 child tickets
- If the axis carried no numbers, a fact in the question would fix the scale first: had Monday's adult part been 9 gridlines high and worth 18 tickets, each gridline would be 18 ÷ 9 = 2 tickets
Pictograms
- A pictogram replaces bars with symbols, and a key states how many one whole symbol represents
- Part-symbols show part-values, so with a key of one symbol representing 4 people, three and a half symbols means 14
- Read the key before anything else, since the same picture means different amounts on different questions
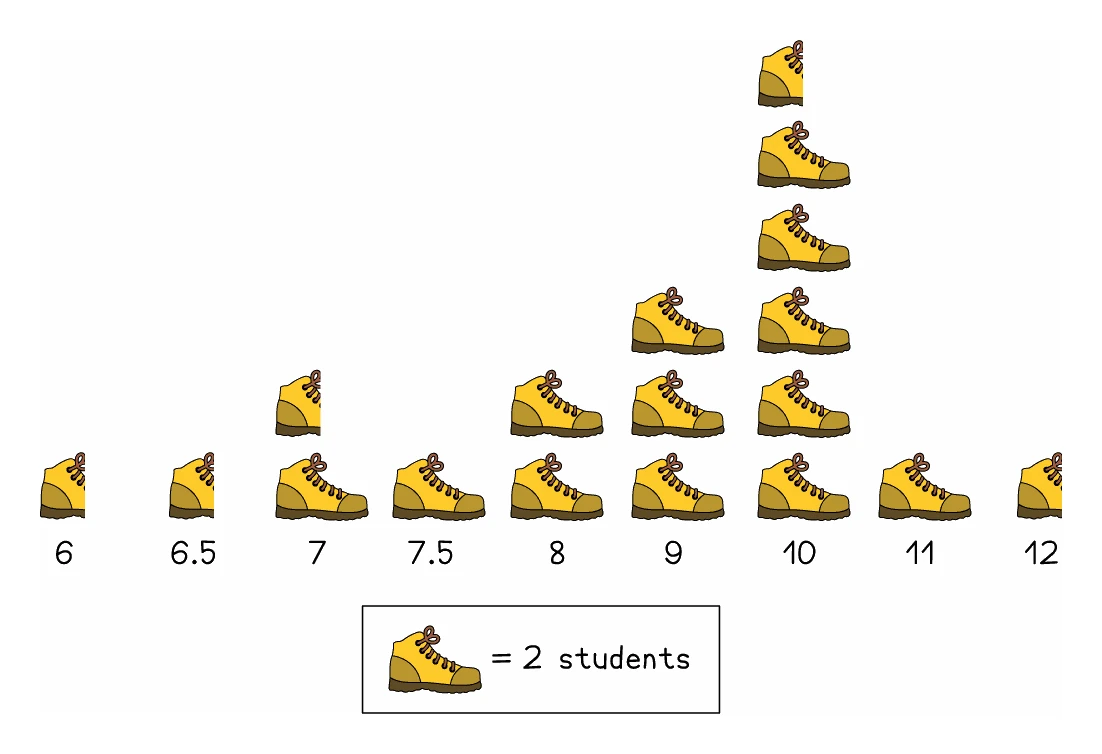
- Choose an easy symbol to draw and halve if you are asked to make one
Worked example
Reading a pictogram
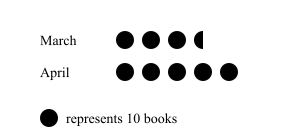
On a pictogram of books read, one symbol represents 10 books. March shows 3 whole symbols and one half symbol. April shows 5 whole symbols. How many books were read in each month, and how many more in April?
Solution:
- Read the key first: every whole symbol stands for 10 books, so a half symbol stands for 5
- March: 3 × 10 = 30, plus the half symbol worth 5
- March = 35 books
- April: 5 × 10 = 50 books
- Difference = 50 − 35 = 15 more books in April
- Counting symbols instead of reading the key would have given 3.5 and 5, which are not numbers of books at all