MathematicsExam code: 0580
Scatter Graphs and Correlation
Statistics
The three types
- Correlation describes whether the two quantities tend to change together, and in which direction
- Positive correlation: both quantities rise together, and the points climb as you read left to right
- Temperature and the number of cold drinks sold
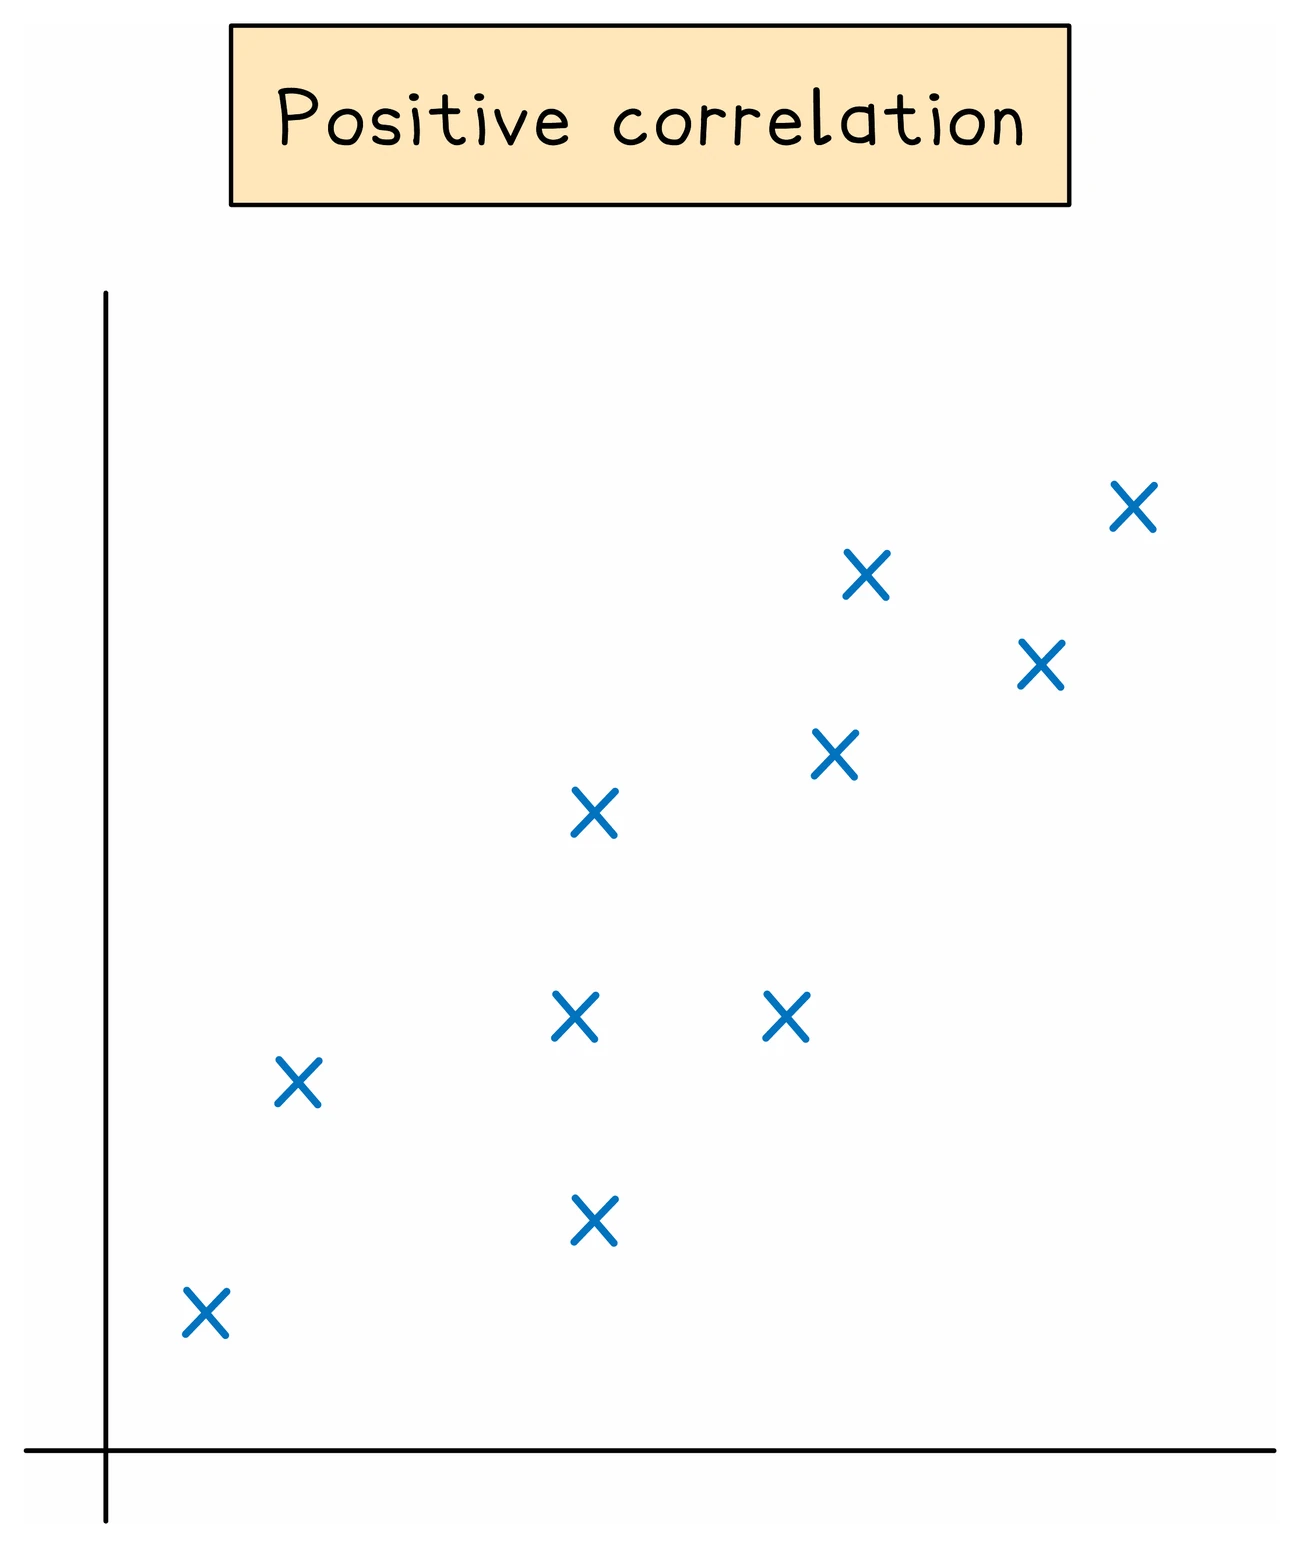
- Negative correlation: one rises while the other falls, and the points descend as you read left to right
- The age of a car and its value
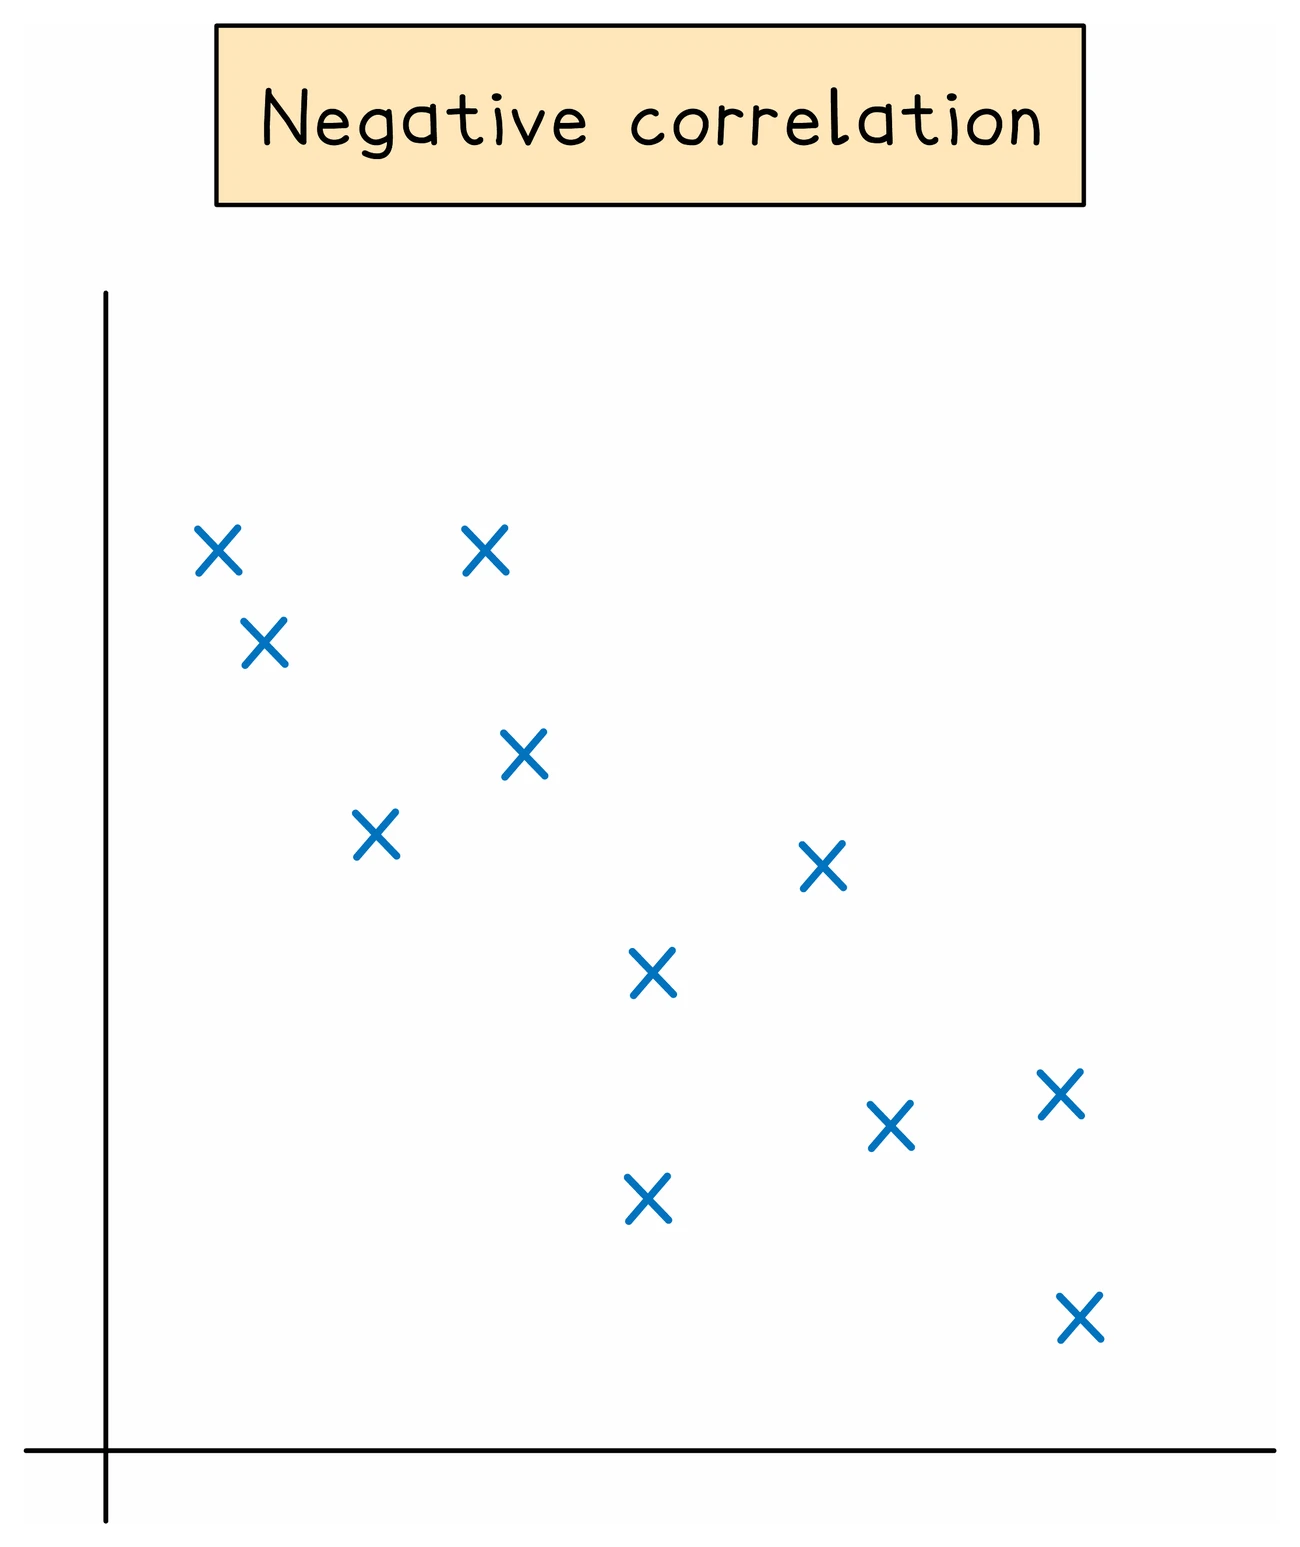
- Zero correlation: no relationship, and the points form a shapeless cloud
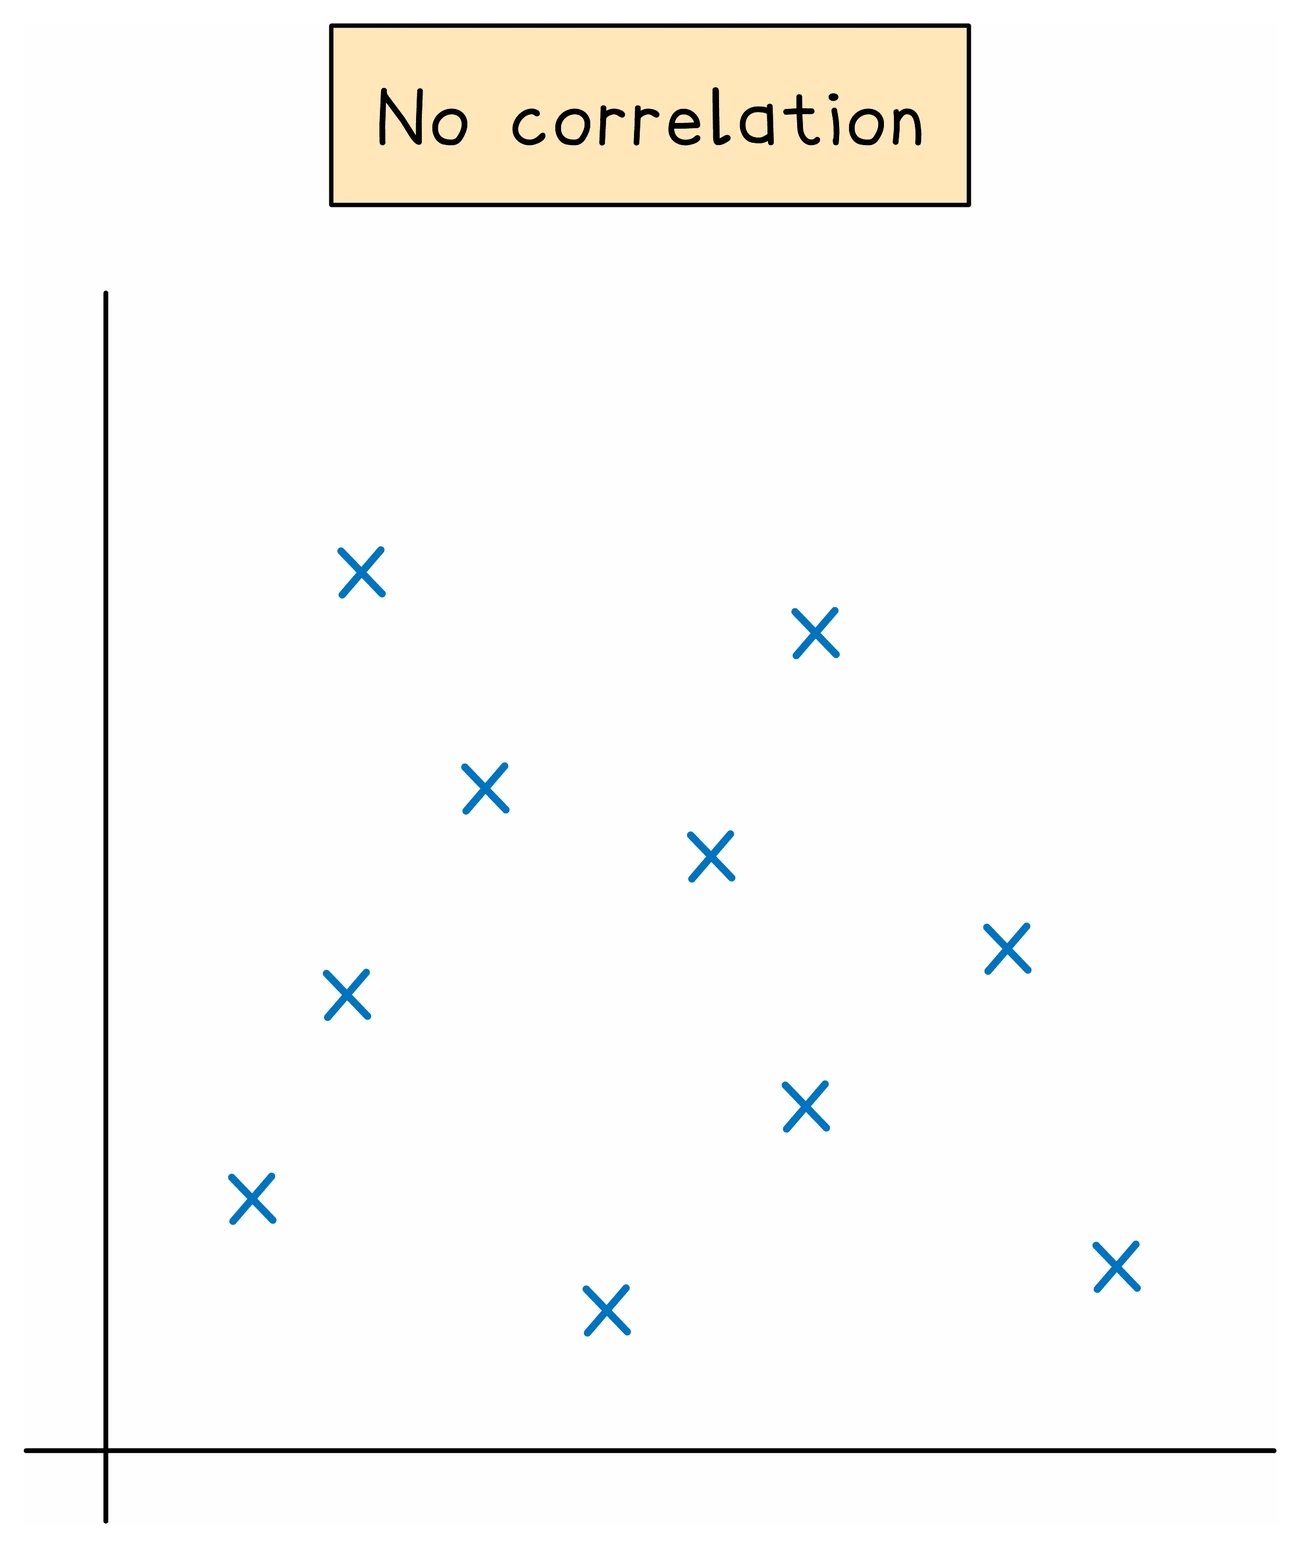
- Correlation can also be described as strong or weak, according to how closely the points cluster around a straight line
Describing it in context
- The standard question asks what type of correlation the diagram shows, for one mark, and the answer is one of those three phrases
- A follow-up may ask you to describe the relationship, which needs the two quantities named rather than just the word
- "As the temperature increases, the number of people on the beach increases"
- Correlation does not prove that one quantity causes the other: both may be driven by something else entirely, and the syllabus asks you to appreciate such restrictions on drawing conclusions
Worked example
Naming and describing correlation
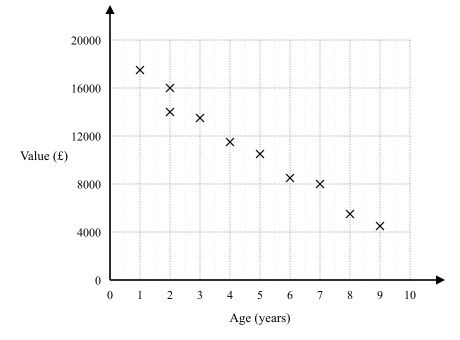
A scatter diagram plots the age of a car in years against its value in pounds. The points fall from the top left towards the bottom right. Name the correlation and describe what it means.
Solution:
- The points descend as you read from left to right, so as one quantity rises the other falls
- The type is negative correlation
- Naming it is one mark; describing it is a separate demand and needs both quantities named
- In context: as the age of a car increases, its value decreases
- "The points go down" is not a description, because it names neither quantity
- Note that this shows a relationship only: correlation on its own never establishes that age causes the fall in value