Mathematics (Core)Exam code: 0580
Linear Graphs
Coordinate Geometry and Graphs
From an equation
- Build a small table of values by substituting three x values that are spread across the axes you are given
- Three points, not two: a slip in one of three points shows up because it misses the line through the other two, whereas two points always look convincing
- Plot the points and join them with a ruled line that runs the full width of the grid
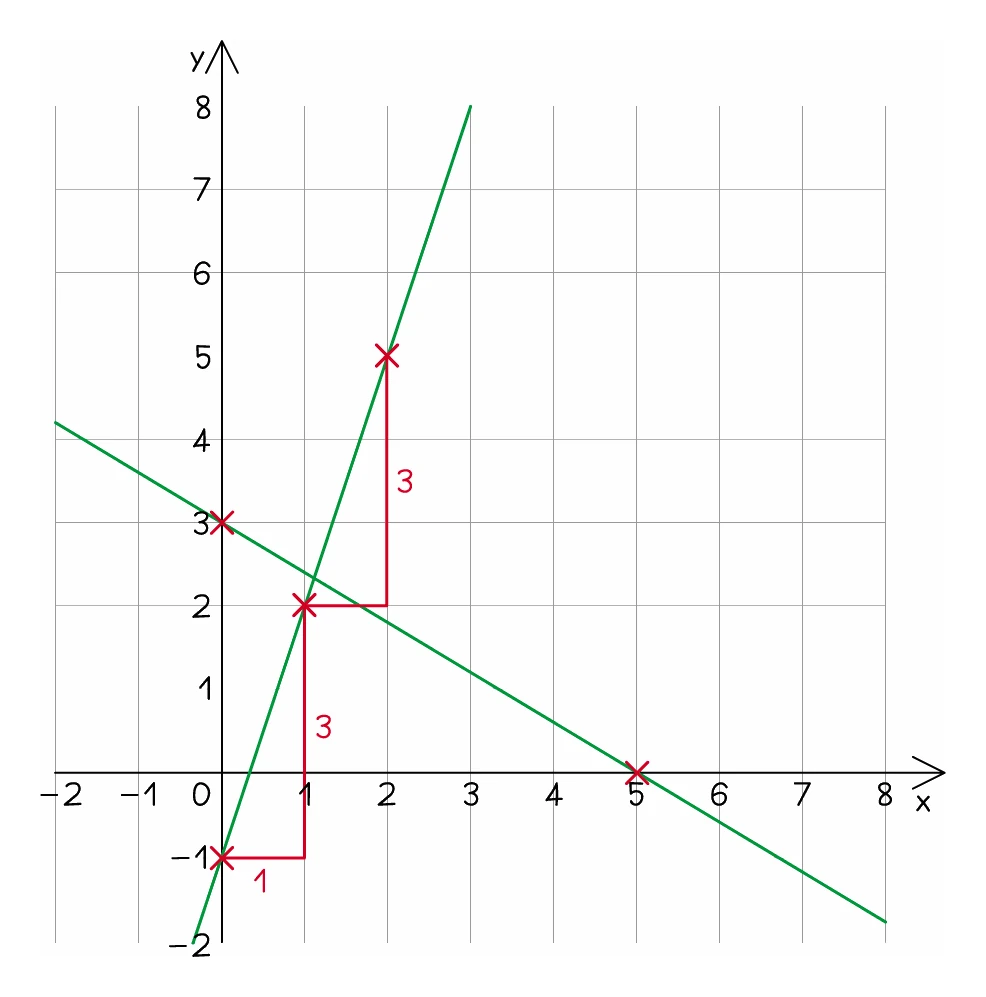
- Alternatively start at (0, c) and step out the gradient, going one right and m up each time, down instead if m is negative
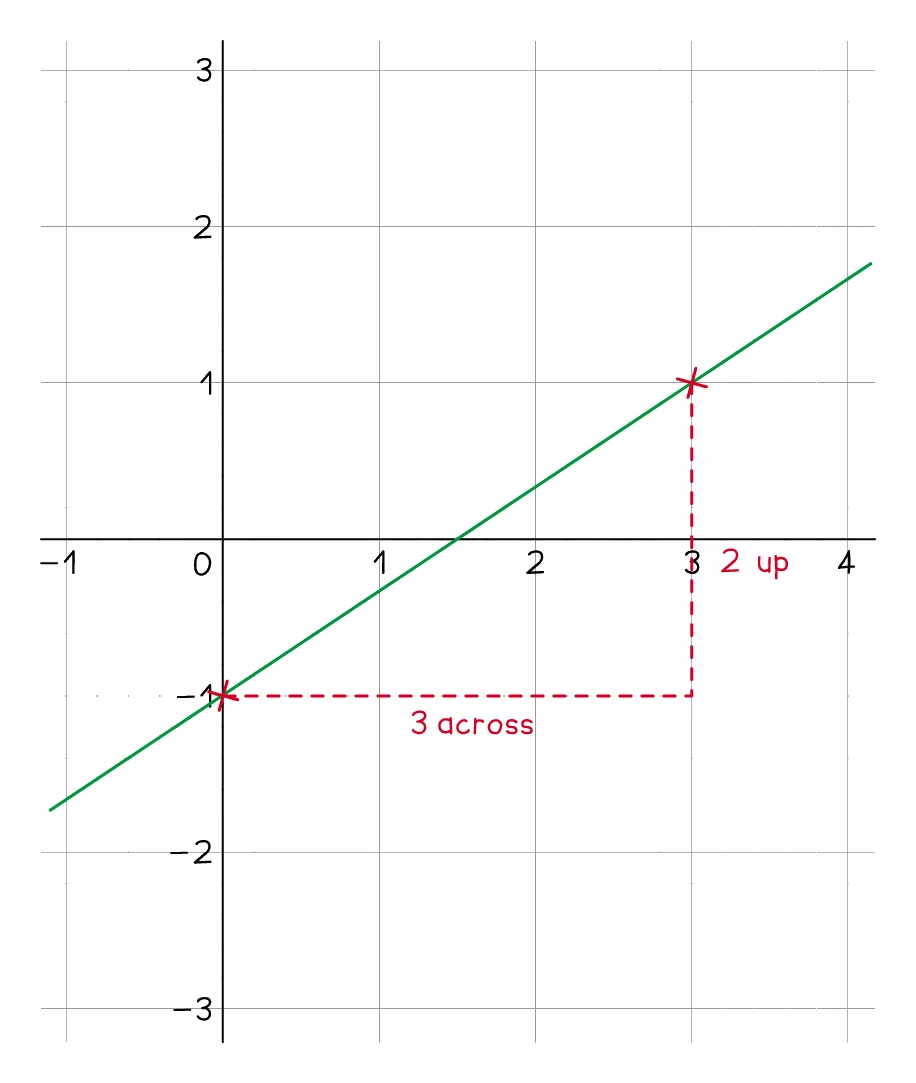
- For a gradient written as a fraction, step across by the bottom number and up by the top number
Worked example
Drawing a line from its equation
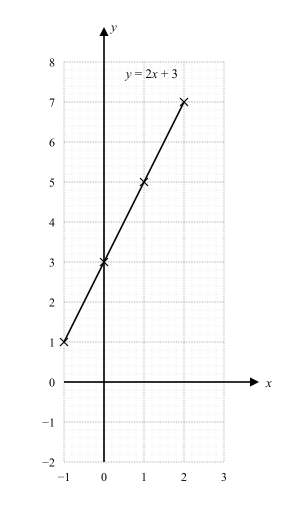
Draw y = 2x + 3 for x from −1 to 2.
Solution:
- Build a short table of values
- x = −1 gives y = 1; x = 0 gives 3; x = 1 gives 5; x = 2 gives 7
- Plot (−1, 1), (0, 3), (1, 5) and (2, 7), and join them with a ruled line