Firms: Types, Mergers & Scale
Microeconomic Decision Makers · 3 question types
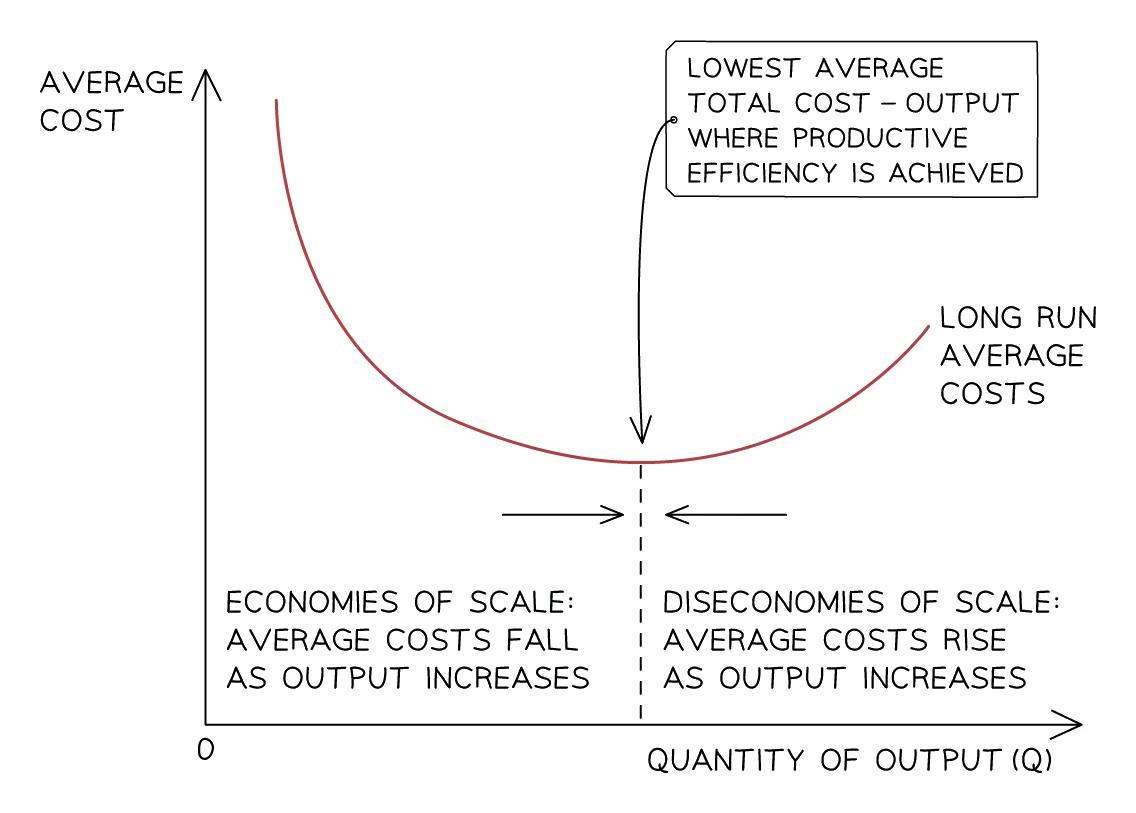
As a firm grows, its average total cost (ATC) typically falls for a while and then, beyond some point, starts to rise. On a diagram this gives a U-shaped average cost curve.
Standard layout of the ATC diagram in the exam:
- Horizontal axis: output (quantity produced per period).
- Vertical axis: average total cost (£ or $ per unit).
- Curve label:
ATC, drawn as a U shape that falls, flattens at its lowest point, then rises. - Range labels: the falling section is labelled , the rising section .
To interpret the diagram, find the bottom of the curve: average total cost is at its lowest at the output directly below it, so drop a dashed line from that point to the output axis and label it as the output with the lowest average total cost. To the left of it the firm is still gaining economies of scale, so expanding output lowers cost per unit. Moving rightwards past it takes the firm into diseconomies of scale, so expanding output now raises cost per unit.
Economies of scale are the fall in average total cost a firm enjoys as it grows in size and output.
Diseconomies of scale are the rise in average total cost a firm suffers once it becomes too large to run efficiently.
The lowest point of the ATC curve is where economies of scale stop and diseconomies of scale begin.
Internal economies of scale
These are cost savings a firm captures as it grows larger.
| Type | What it is |
|---|---|
| Technical | Larger, specialised machinery and longer production runs lower the cost per unit. |
| Financial | Big firms borrow at lower interest rates and can raise finance more easily than small firms. |
| Marketing | Advertising and branding costs are spread over a much larger output, so cost per unit sold is tiny. |
| Managerial | Large firms can employ specialist managers for finance, marketing and operations. |
| Purchasing | Bulk-buying raw materials earns discounts that small firms cannot get. |
| Risk-bearing | Large firms diversify across products and markets, so a bad year in one area is offset elsewhere. |
Internal diseconomies of scale
Beyond that point, problems begin to push average cost back up.
| Type | What goes wrong |
|---|---|
| Communication | Messages get distorted across more layers of management. |
| Coordination | A huge firm with many divisions struggles to keep everyone working to the same goal. |
| Control | Senior managers cannot oversee everything, so inefficiency creeps in. |
| Motivation | Workers feel like a small cog in a giant machine, so productivity falls. |
External economies and diseconomies
These affect all firms in an industry as the industry grows, not just one firm. External economies include a pool of skilled local labour, specialist suppliers locating nearby and shared infrastructure, all of which lower every firm's costs. External diseconomies include rising local wages, congestion and higher land prices as too many firms cluster in one area, which raise every firm's costs.
Analyse the benefits of growing in size (6 marks)
What comes up: "Analyse the benefits a firm may gain from growing in size" (6 marks), or a discuss question on whether a larger firm benefits consumers (8 marks).
Write: A larger firm can gain economies of scale (1) — for example, purchasing economies from bulk-buying cut its average cost per unit (1), and technical economies from larger, more specialised machinery lower unit cost further (1). The mark scheme also credits financial, managerial and marketing economies. For 8 marks, add the other side: beyond a certain scale the firm may suffer diseconomies of scale (1) — communication and coordination problems, or weaker worker motivation, raise average costs (1).
Write — if the question asks for an ATC diagram: label the horizontal axis output and the vertical axis average total cost (1); draw a U-shaped curve and label it ATC (1); label the falling section economies of scale and the rising section diseconomies of scale (1). Separate marks are given for the labelled axes and for a correctly shaped and labelled curve, so an unlabelled sketch throws marks away.
Watch out: Do not just say "costs fall". The second mark in each pair is for explaining why cost per unit falls as output rises. For diseconomies, name a specific cause (communication, coordination or control problems), not just "the firm gets too big".