Pseudocode and Flowcharts
Algorithm Design and Problem Solving
A trace table is a table used to record the value of each variable at every step of an algorithm, so that the algorithm can be hand-executed and checked for correctness.
Trace tables are essential for finding logic errors, where a program runs without crashing but produces the wrong output. By stepping through the algorithm with specific test data, the programmer can spot the exact step where the variables go wrong.
An algorithm like the "find the highest of ten numbers" flowchart below, with a counter and a decision inside a loop, is a typical candidate for a trace table:
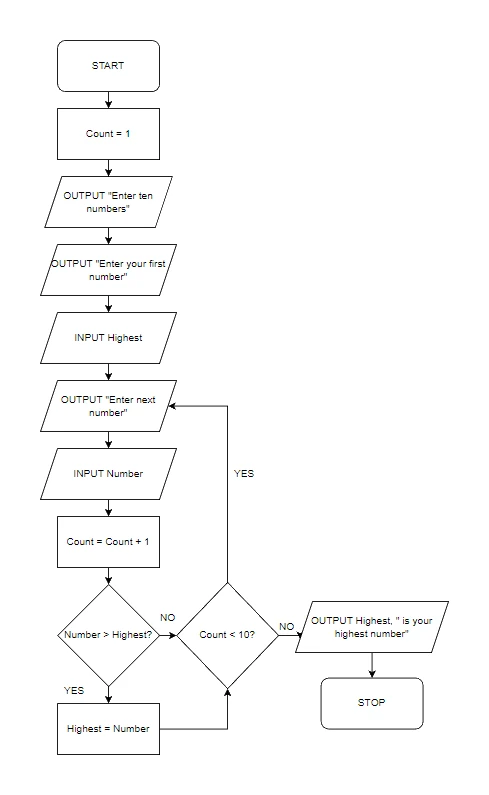
How to set up a trace table
- List the variables the algorithm uses as column headings. Include any output as the last column.
- Number the rows (optional, but useful for long algorithms).
- Walk through the line by line, updating the relevant column whenever a variable changes.
- Note any output in the OUTPUT column when an
OUTPUTstatement is reached. - Continue until the algorithm finishes (the loop terminates or the program reaches END).
Common exam question
Completing a trace table
Question: A flowchart or pseudocode algorithm is given with its input data or an array's contents; complete the trace table whose headings are printed (2–7 marks, usually 5 or 6).
Asked in 7 of the 17 papers, every Paper 2 but one. Marks go column by column: each entirely correct column usually earns a mark, OUTPUT included, though related columns sometimes share one; in one scheme, array columns with a single error kept one of two marks. Fill a cell in each row where the algorithm assigns that variable, even if the value is the same as before, and leave the rest blank.
Most of these algorithms stop on a terminating value such as −1, and the data deliberately continues past it: the trace ends when that value is read. Record each OUTPUT in the row where it happens, even a message printed inside the loop. One paper asked only for the headings: every variable plus OUTPUT, nothing else, since an extra heading costs the final mark.
Why trace tables are useful
- Finding logic errors: if
Highestdoes not update when it should, the trace table reveals the exact step where the bug is. - Verifying loop termination: walking through the loop counter line by line shows that the loop ends when it is meant to.
- Understanding unfamiliar algorithms: a trace table forces a careful, step-by-step reading and often makes the purpose of the algorithm obvious.
- Picking suitable test data: tracing with boundary and abnormal data (topic 18) checks the program's edge cases.
Worked example
Tracing a loop that stops on a terminating value
The algorithm below reads values until −1 is entered. Draw up a trace table with the columns Total, Count, Value, Tens, Units and OUTPUT, and trace the algorithm for the inputs 33, 7, 50, 44, −1, 88, 12.
Total ← 0
Count ← 0
REPEAT
    INPUT Value
    IF Value <> -1
      THEN
        Tens ← DIV(Value, 10)
        Units ← MOD(Value, 10)
        IF Tens = Units
          THEN
            OUTPUT "Double"
            Count ← Count + 1
        ENDIF
        Total ← Total + Value
    ENDIF
UNTIL Value = -1
OUTPUT "Total ", Total
OUTPUT "Doubles ", Count
Solution:
- Before the loop, Total and Count are 0: that is the first row.
- 33: DIV(33, 10) = 3 and MOD(33, 10) = 3, so Tens = Units, "Double" is output and Count becomes 1; Total becomes 33.
- 7: Tens = 0 and Units = 7, no output; Total becomes 40.
- 50: Tens = 5 and Units = 0, no output; Total becomes 90.
- 44: Tens = 4 = Units, "Double" is output and Count becomes 2; Total becomes 134.
- −1: the IF is skipped, the UNTIL condition is true and the loop ends. 88 and 12 are never read.
- The two final OUTPUT lines print Total 134 and Doubles 2.
| Total | Count | Value | Tens | Units | OUTPUT |
|---|---|---|---|---|---|
| 0 | 0 | ||||
| 33 | 1 | 33 | 3 | 3 | Double |
| 40 | 7 | 0 | 7 | ||
| 90 | 50 | 5 | 0 | ||
| 134 | 2 | 44 | 4 | 4 | Double |
| −1 | Total 134 | ||||
| Doubles 2 |
Count stays blank on the rows for 7 and 50 because it does not change there.
Common exam question
Stating the purpose of a traced algorithm
Question: Usually after the trace table: state or describe the purpose of the algorithm, or outline the processes it carries out (1–3 marks).
Asked in 6 of the 17 papers. Say what the algorithm achieves, not what each line does; your trace shows the pattern. Credited answers read like "sorts the array into ascending order", "finds the total and average of each batch of numbers and outputs them when 0 is entered", "checks whether an input is divisible by 10 and totals those that are" or "multiplies the input by every smaller number down to 1".
For two marks make two separate points: what is calculated or checked, and what is output or happens at the end (the result is printed, a new batch starts). Naming a standard algorithm counts when there is one: "bubble sort" was credited beside the description. For "outline the processes", give the stages in order: values input and stored, sorted, middle value output.