MathematicsExam code: 0580
Probability Diagrams
Probability
Reading a probability off
- A Venn diagram may show the individual items, or just how many fall in each region
- Either way, the probability is the count in the regions you want divided by the total count
- Fill in the overlap first, then work outwards, because the numbers given usually include the overlap
- If 18 play football, 14 play tennis and 7 play both, then 11 play only football and 7 play only tennis
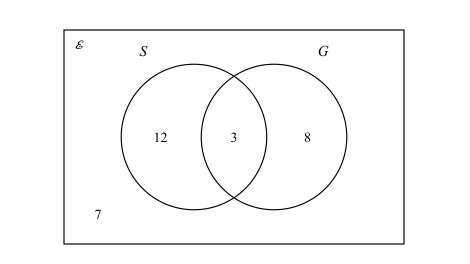
- The region outside both circles holds everything in neither, and it is easy to forget when totalling
- The notation P(A ∩ B) for "both" and P(A ∪ B) for "either" may be used
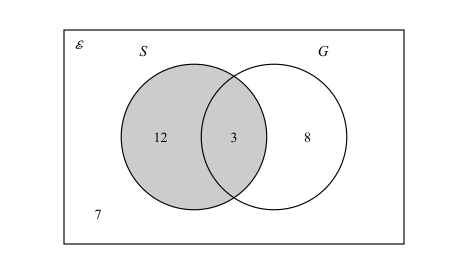
Worked example
Probabilities from a Venn diagram
In a group of 30 students, 18 play football, 14 play tennis and 7 play both. Find the probability that a student chosen at random plays neither sport. Then two of the football players are chosen at random: what is the probability that exactly one of them also plays tennis?
Solution:
- Start with the overlap: 7 play both
- Football only = 18 − 7 = 11, and tennis only = 14 − 7 = 7
- Those three regions hold 11 + 7 + 7 = 25 students
- So the number playing neither is 30 − 25 = 5
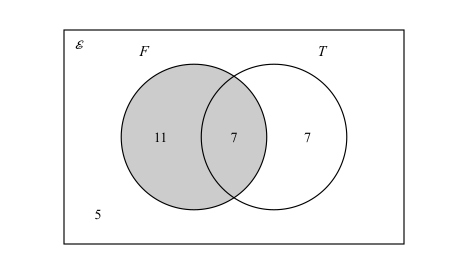
- P(neither) = 5/30 = 1/6
- For the second part, both students come from the football circle, so the first pick is out of 18, not 30
- Of those 18, the 7 in the overlap play tennis and the 11 in football only do not
- Two different students are chosen, so the second pick is out of the 17 who are left
- Exactly one plays tennis means tennis then not, or not then tennis
- P(exactly one) = 7/18 × 11/17 + 11/18 × 7/17 = 77/306 + 77/306 = 154/306 = 77/153