Set Notation and Probability Diagrams
Probability
How the diagram is built
- A Venn diagram shows sets as circles inside a rectangle, where the rectangle is the universal set
- Overlapping circles share the elements that lie in both sets
- Anything belonging to no named set is written inside the rectangle but outside every circle
- This specification limits Venn diagrams to two sets
Regions and operations
- Each operation corresponds to a region of the diagram, which is what makes the notation easy to apply
- The union covers both circles entirely; the intersection covers only the overlap
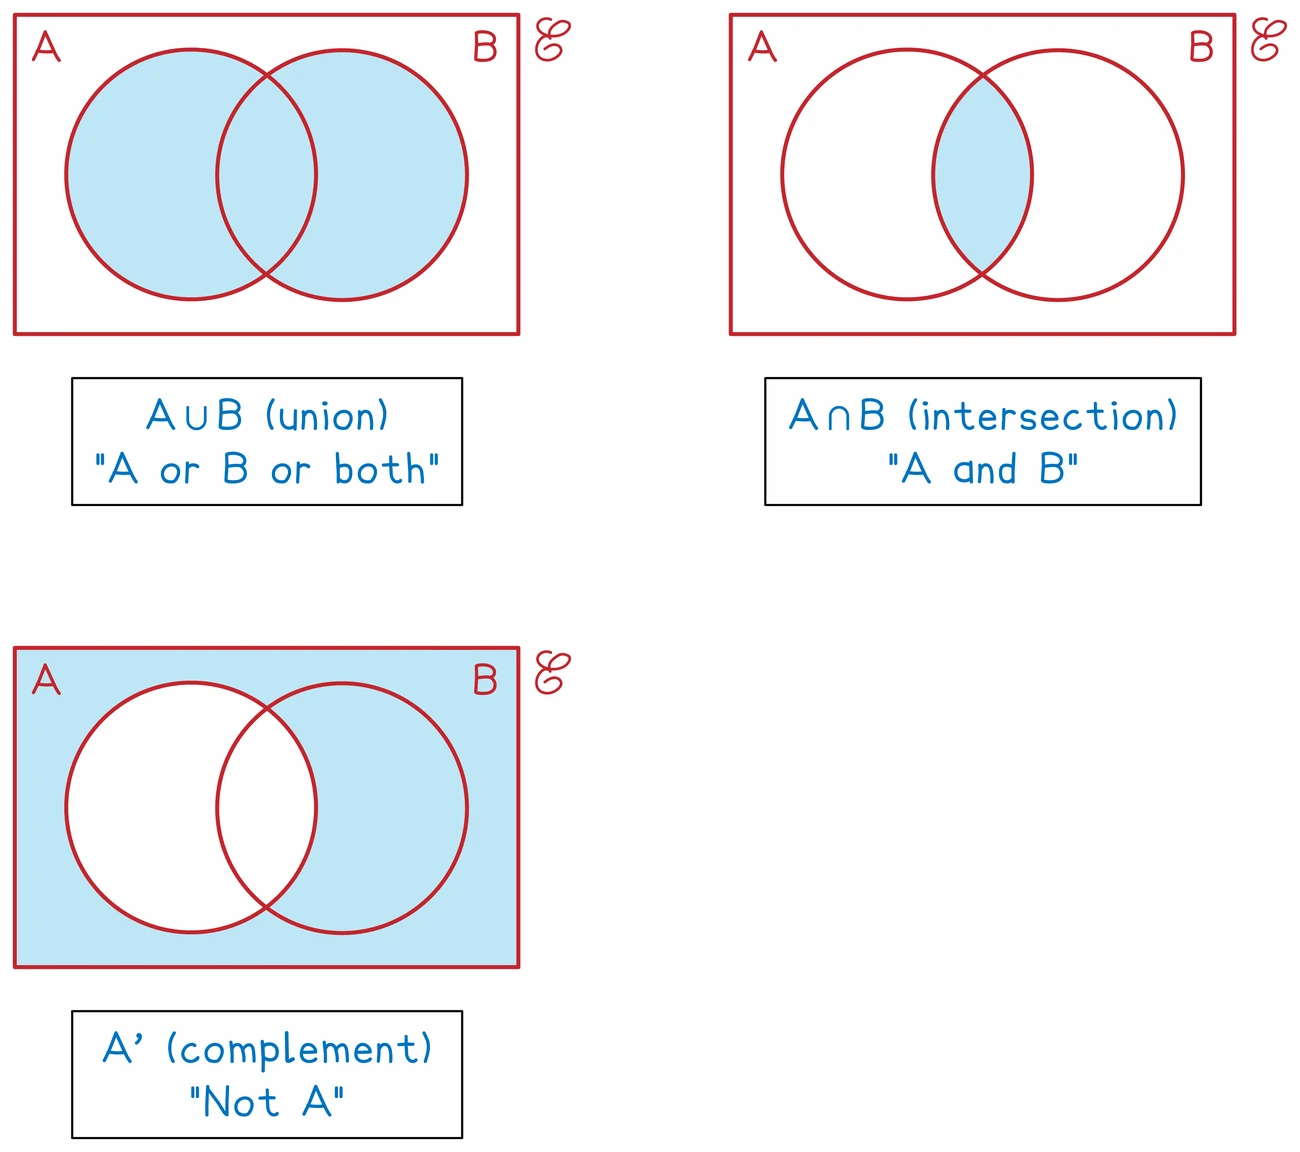
- A complement shades everything outside the named set but still inside the rectangle
- Combined expressions are read from the inside out, so (A ∪ B)′ means shade everything the union does not cover
Counting from a diagram
- n(A) counts every element inside circle A, including those in the overlap
- Elements in the overlap belong to both sets and are counted once in a union
Exam tip
Fill every region first
The parts after a Venn diagram, such as n(A ∩ B), a list or a probability, are usually marked from your own diagram, so a slip in the diagram need not cost them as well. That follow-through needs something written in each region the answer uses, so fill every region before you move on, then read each answer off your diagram rather than working it out again from the question.
Worked example
Placing elements in a Venn diagram
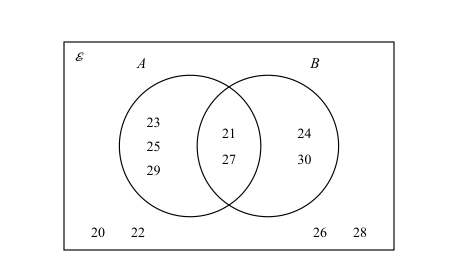
ℰ = {x : x is an integer, 20 ⩽ x ⩽ 30}, A = {odd numbers} and B = {multiples of 3}. Show A and B on a Venn diagram, then find n(A ∪ B) and list the elements of A′.
Solution:
- List each set from ℰ first: A = {21, 23, 25, 27, 29} and B = {21, 24, 27, 30}
- Fill the overlap first: 21 and 27 are both odd and multiples of 3
- A only: 23, 25, 29; B only: 24, 30
- Outside both circles, inside the rectangle: 20, 22, 26, 28
- Check the count: 3 + 2 + 2 + 4 = 11, and ℰ holds the 11 integers from 20 to 30, so each is placed exactly once
- A ∪ B covers both circles, so n(A ∪ B) = 3 + 2 + 2 = 7, with 21 and 27 counted once
- A′ is everything in ℰ outside circle A: {20, 22, 24, 26, 28, 30}
Worked example
Counting from a Venn diagram
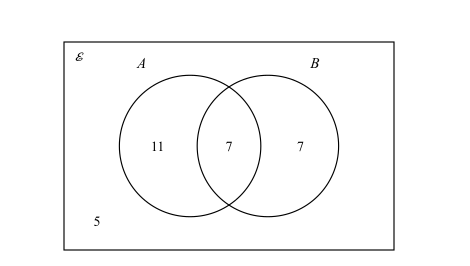
In a group of 30 students, 18 study art (A) and 14 study biology (B). 7 study both. Show this on a Venn diagram, then work out how many study neither.
Solution:
- Fill the overlap first, because the two given totals each already include it
- The intersection holds 7
- Art only = 18 − 7 = 11
- Biology only = 14 − 7 = 7
- Those three regions hold 11 + 7 + 7 = 25 students
- The universal set holds 30, so the region outside both circles holds 30 − 25 = 5
- Check by adding all four regions: 11 + 7 + 7 + 5 = 30
- Writing 18 in the art circle and 14 in the biology circle would count the 7 twice and total 39