Mathematics (Core)Exam code: 0580
Real Life Graphs
Coordinate Geometry and Graphs
What the picture shows
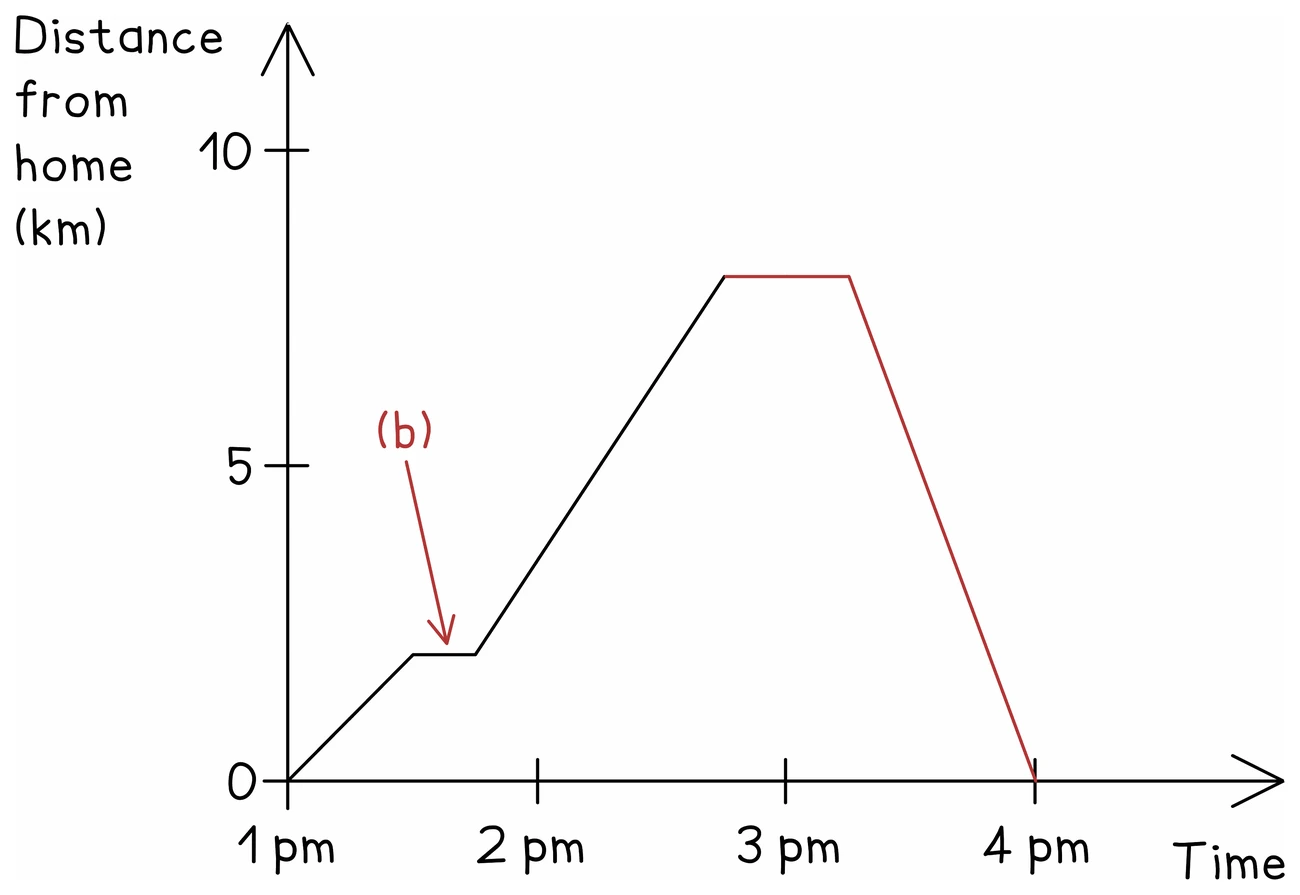
- A travel graph puts distance on the vertical axis and time on the horizontal one, so the line traces a journey
- The vertical axis usually reads "distance from" a named place, so it shows position rather than distance covered
- A sloping line means movement, and the steeper it is the faster the journey
- A line sloping up leads away from the starting place; one sloping down comes back towards it
- A horizontal line means the distance is not changing, so the traveller has stopped
- Times along the bottom are usually written in 24-hour clock form
Speed from the graph
- The gradient of a sloping section is the speed of that section
- Speed is the distance covered divided by the time taken, so read both from the grid and divide
- Take the units from the axes: kilometres against hours gives km/h, metres against seconds gives m/s
- Convert a time read in minutes to hours before dividing, or the speed comes out sixty times too small
- The average speed for a whole journey is the total distance divided by the total time, and the total time includes every stop
Worked example
A there-and-back journey
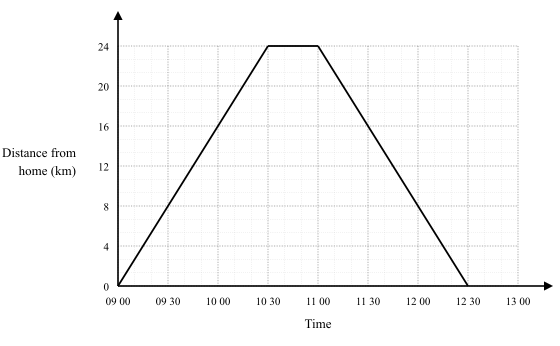
A cyclist leaves home at 09 00 and rides 24 km to a village, arriving at 10 30. She rests for 30 minutes, then returns home, arriving at 12 30. Find her speed on the outward ride and her average speed for the journey as a whole.
Solution:
- The outward ride runs from 09 00 to 10 30, which is 1.5 hours
- Speed out = 24 ÷ 1.5 = 16 km/h
- The rest lasts from 10 30 to 11 00, drawn as a horizontal line
- The return runs from 11 00 to 12 30, also 1.5 hours, so the return speed is also 16 km/h
- For the average speed, the total distance is 24 + 24 = 48 km
- The total time is 09 00 to 12 30, which is 3.5 hours, including the rest
- Average speed = 48 ÷ 3.5 = 13.714…, which is 13.7 km/h to 3 significant figures
- To add a journey to a printed travel graph, work out where it starts and where it ends, mark both points, and join them with a ruled line