Exam Frequency Analysis
Past paper frequency (2018 to 2024)
This topic accounts for approximately 18% of your exam marks.
stable
Very High
Stable18%
Supply appears alongside demand on virtually every paper; cost changes, technology, and taxes/subsidies are the most tested supply shifters.
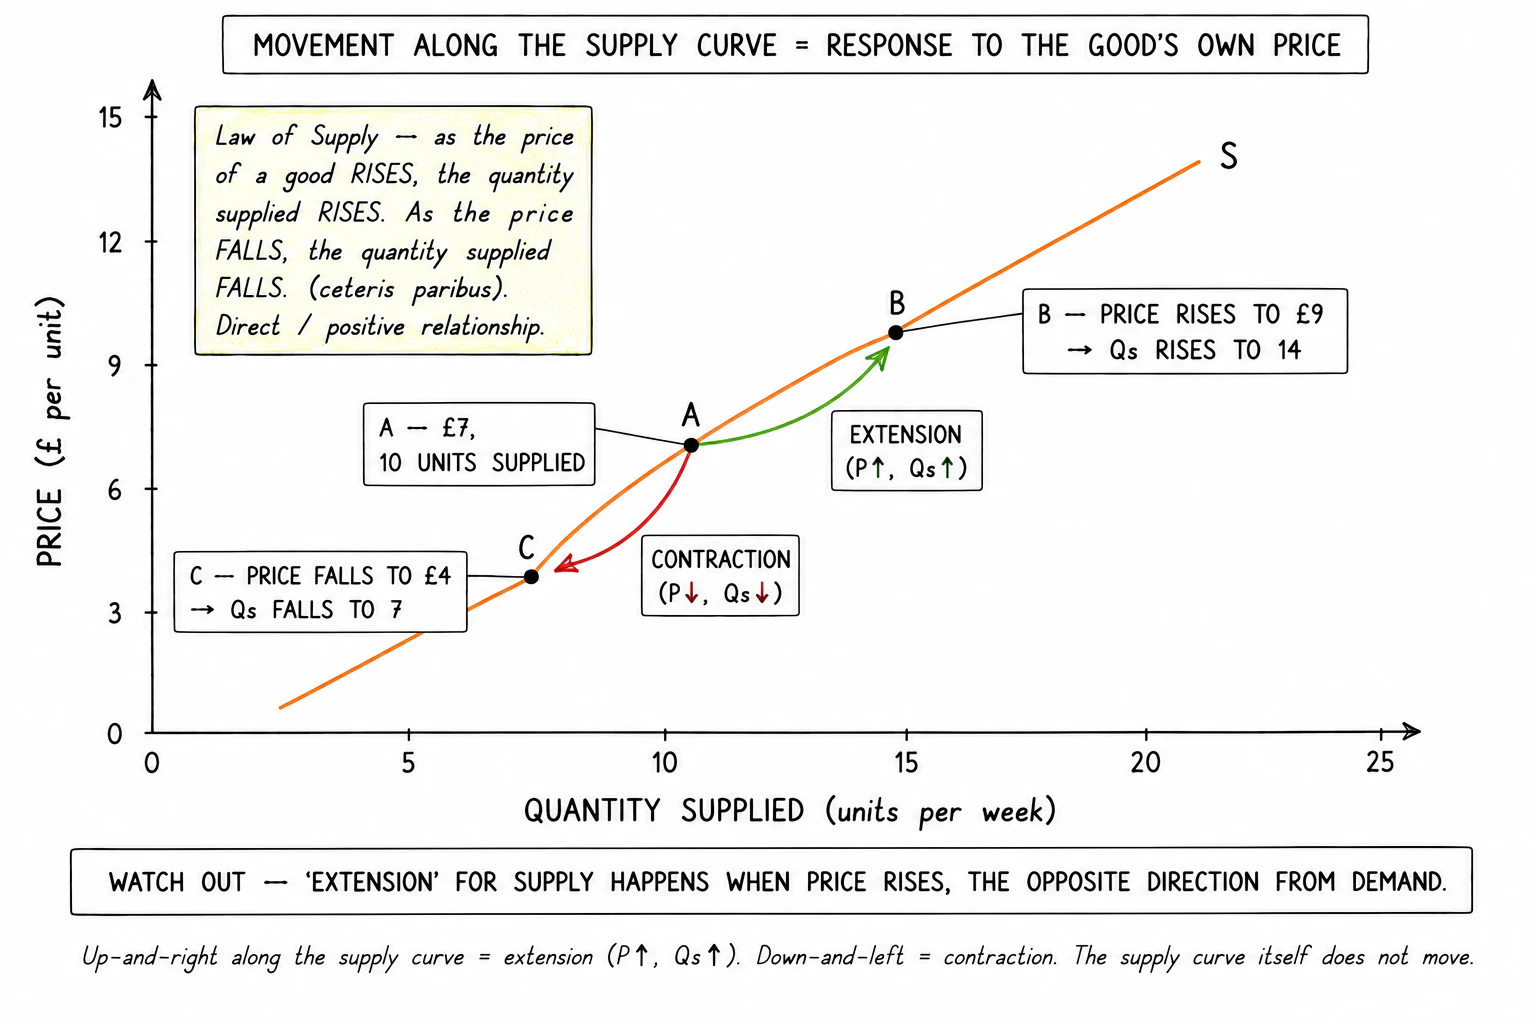
A plots the quantity of a good producers will offer (horizontal axis) against the price (vertical axis). It slopes upward from lower-left to upper-right, the opposite direction to the demand curve. Exam diagrams use straight lines for ease.
Standard layout on every supply-curve diagram:
- Vertical axis: price (in £ or $ per unit).
- Horizontal axis: quantity supplied per period (units per week, per month).
- Curve label:
Sfor the supply curve. Shifts toS₁(left, less supplied) orS₂(right, more supplied) when conditions of supply change.