Supply
Allocation of Resources · 4 question types
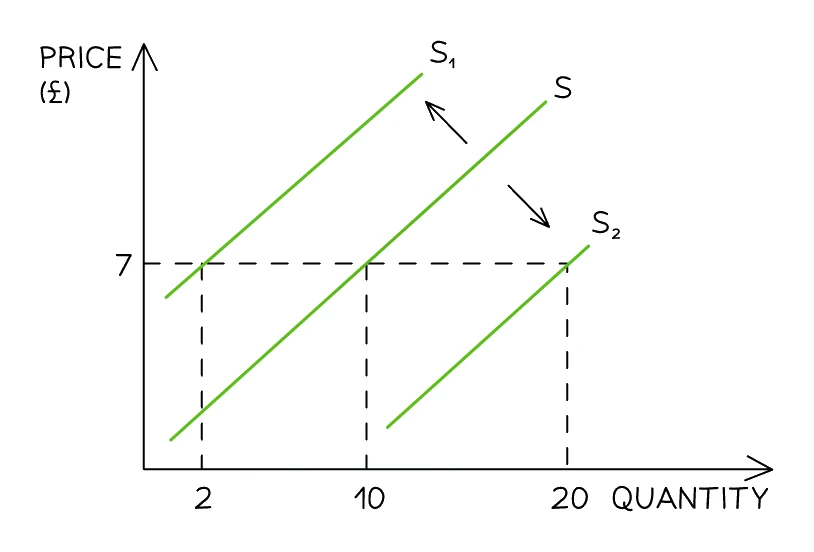
A change in any factor other than the good's own price moves the whole curve sideways. These non-price factors are collectively called the .
Increase in supply = a rightward shift of the curve (to S₂). At every price, producers now offer more.
Decrease in supply = a leftward shift of the curve (to S₁). At every price, producers now offer less.
A useful mnemonic: CONTEST
Around seven non-price supply factors come up regularly. The mnemonic CONTEST covers them.
| Letter | Stands for | Effect on supply |
|---|---|---|
| C | Costs of production | Costs ↑ (higher wages, fuel, raw materials) → supply ↓ (curve shifts left). Costs ↓ → supply ↑. |
| O | Other goods' prices | If a related product becomes more profitable to make, firms switch to it, reducing supply of this good. |
| N | Number of producers | More firms entering the industry → market supply ↑. Firms exiting → market supply ↓. |
| T | Technology | New, better technology lowers unit costs and raises productivity → supply ↑. Ageing or broken technology → supply ↓. |
| E | Expectations of future prices | If producers expect prices to rise soon, they may hold stock back today, reducing current supply. The reverse if they expect prices to fall. |
| S | Subsidies | A government subsidy lowers each producer's effective cost → supply ↑. Removing a subsidy → supply ↓. |
| T | Taxes (indirect) | A tax on producers (VAT, excise duty) raises their cost of bringing the good to market → supply ↓. Cutting an indirect tax → supply ↑. |
Beyond CONTEST, another commonly examined non-price factor is weather events (especially for agricultural products): a drought or flood destroys crops and shifts supply left; unusually good growing conditions shift supply right.
The conditions of supply in detail
1. Costs of production. This is the single most-tested supply factor on the exam. Anything that raises a firm's costs reduces the profit it earns from each unit sold and so reduces supply at every price.
- A rise in wages (labour cost) shifts supply left.
- A rise in raw material prices (e.g. oil, steel, wheat) shifts supply left.
- A rise in energy costs shifts supply left.
- A rise in rent or interest on borrowing shifts supply left.
Falls in any of these costs shift supply right. Costs of production are sometimes called input costs.
2. Other goods' prices. A firm with flexible production can switch between making different products. If a related product becomes more profitable (its price rises), the firm shifts resources toward it and reduces supply of the original good. A farm that can grow either wheat or rapeseed will plant more rapeseed if the rapeseed price rises, reducing wheat supply.
3. Number of producers. More firms in the market = larger total market supply. Firms enter when profits look attractive (rising prices, falling costs); they exit when losses persist. The supply curve of the whole market depends on how many firms are operating.
4. Technology. New technology that raises productivity (output per worker, output per hour) shifts supply right. Examples: precision farming raising crop yields; automation raising factory throughput; AI tools speeding up software development. Technology shocks (a system failure, the loss of a critical supplier) can shift supply left.
5. Expectations of future prices. A producer who expects prices to rise next month may hold inventory back today (storing crops, restricting output) to sell at the higher future price; current supply falls. Expecting prices to fall has the opposite effect: producers offload stock now, raising current supply.
6. Subsidies. A subsidy is a payment from the government to producers that lowers their effective per-unit cost. Subsidies are common for products the government wants to encourage (solar panels, electric vehicles, public transport). A subsidy shifts the supply curve right: at every price, producers can profitably supply more.
7. Indirect taxes. An (VAT, excise duty on alcohol, fuel duty, sugar tax) raises the cost of each unit sold. It shifts the supply curve left: at every price, less is supplied.
A trap that examiners specifically test: a subsidy or tax aimed at consumers of a good does not shift supply — it changes demand. The clean answer is: subsidies and taxes on producers shift ; subsidies and taxes on consumers affect demand.
What shifts the supply curve (and what does not)
What comes up: an MCQ presents four possible causes and asks which one shifts the supply curve — or an explain/analyse question asks what would cause supply to increase or decrease.
Write: any non-price factor shifts the whole curve. Examples the mark scheme credits: a fall in costs of production (wages, raw materials, energy) shifts supply right; an improvement in technology shifts supply right; a government subsidy paid to producers shifts supply right; a rise in an indirect tax on producers shifts supply left; a drought or poor weather shifts agricultural supply left; more firms entering the industry shifts market supply right.
Watch out: a change in the good's own price never shifts the supply curve — it only moves the point along the existing curve. Also, subsidies or taxes aimed at consumers affect demand, not supply; only measures directed at producers shift the supply curve.