Differences in Development between Countries
Economic Development
The distinction is not just "rich" vs "poor". Each category has a recognisable set of features.
Developed countries
Developed countries have high GDP per capita, advanced industry and services, high HDI (topic 16), and an ageing population structure with low birth and death rates.
Typical characteristics:
- High GDP per capita: usually above $25,000 in PPP terms.
- Services-dominated economy. A large share of output and employment is in tertiary activities (finance, retail, healthcare, education, technology). Primary-sector employment is often under 5%.
- High HDI: usually above 0.85.
- Long life expectancy at birth, often above 80.
- Low birth and death rates: births often near or below the replacement level.
- High capital stock per worker: modern factories, infrastructure, transport networks.
- Advanced technology and high innovation rates.
- High urbanisation: typically 75%+ of the population live in cities.
- Strong institutions: rule of law, well-functioning courts, low corruption, stable democracy.
Examples: Germany, Japan, the United States, the United Kingdom, South Korea, Australia.
Exam tip
Discuss: does a high-GDP country mean higher living standards?
What comes up: An 8-mark question asks whether people in countries with a high GDP enjoy higher living standards than those in countries with a low GDP.
Write (two sides): For the "yes" side: (1) higher income allows people to afford better nutrition, housing and healthcare, raising life expectancy; (2) higher incomes enable people to buy more goods and services, including education, leading to better job prospects and wellbeing. For the "might not" side: (1) a high total GDP does not necessarily mean high GDP per head — if the population is very large, average income may still be low; (2) income may be very unevenly distributed, so many people remain in poverty despite a large national income; (3) people may work very long hours, leaving little leisure time, which lowers quality of life even as incomes rise; (4) higher GDP may also bring greater pollution and congestion. Judgement: High GDP is a useful starting point but an incomplete indicator — distribution, working conditions and non-material factors all matter.
Watch out: Do not treat GDP and GDP per head as the same thing. A mark scheme will credit the distinction between total output and output per person as a separate point.
Developing countries
Developing countries have lower GDP per capita, a much larger primary sector, lower HDI, and a younger population structure with higher birth and death rates.
Typical characteristics:
- Lower GDP per capita: usually well below $15,000 in PPP terms.
- Larger primary sector. Agriculture, mining, fishing and forestry account for a much higher share of employment, sometimes 40% or more.
- Lower HDI: usually below 0.75.
- Shorter life expectancy, often 65–75 years.
- Higher birth and death rates: births and deaths both remain well above those of developed countries.
- Lower capital stock per worker: fewer machines, less developed infrastructure.
- Lower technology levels and slower innovation.
- Lower urbanisation, with a large rural population.
- Weaker institutions, with higher corruption and more political instability in many cases.
Examples: India, Nigeria, Bangladesh, Kenya, Vietnam, Bolivia.
Both categories cover a wide range. "Developing" includes both least-developed countries (very low income, weak institutions) and emerging-market economies (middle income, fast-growing) like India, Brazil and Vietnam. A single label hides huge variation.
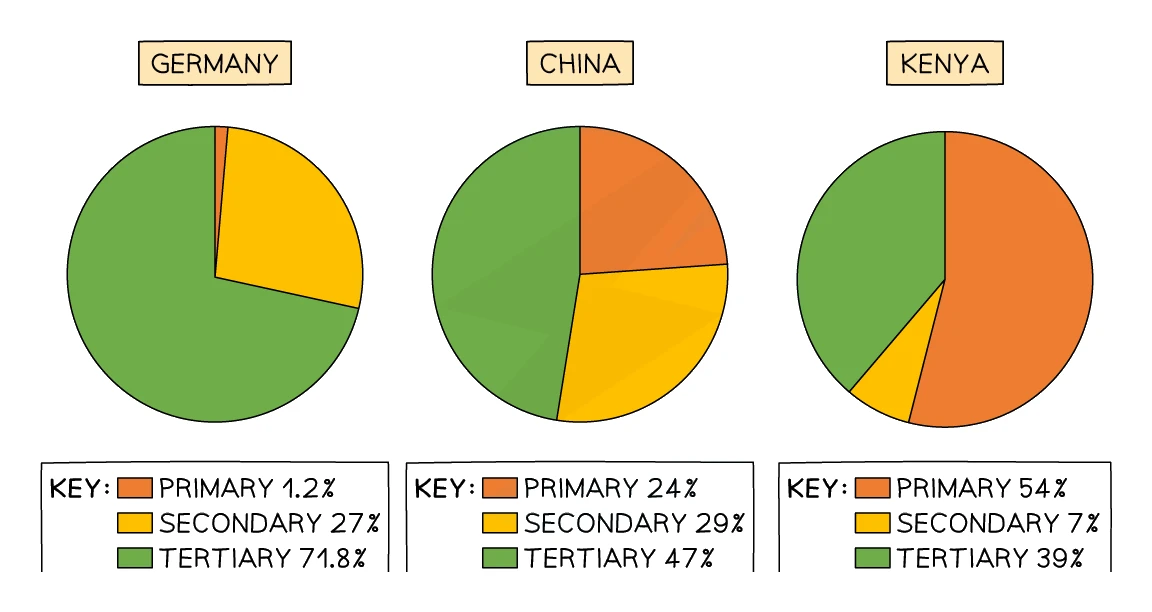
The contrast shows up clearly in the sector composition of employment. A developed economy like Germany has a tiny primary sector and a services-dominated economy; an emerging economy like China has a larger secondary and primary share; a lower-income economy like Kenya still has most of its workforce in the primary sector.
Structural change as countries develop
As countries grow richer, the structure of their economy changes in a consistent pattern.
| Sector | Share of output and employment |
|---|---|
| Primary (agriculture, mining) | High in early development, falls steadily |
| Secondary (manufacturing, construction) | Rises in mid-development, peaks, then declines |
| Tertiary (services) | Low in early development, dominates in advanced economies |
The progression is primary → secondary → tertiary as a country develops. Alongside this, urbanisation rises and birth and death rates fall (topic 17).
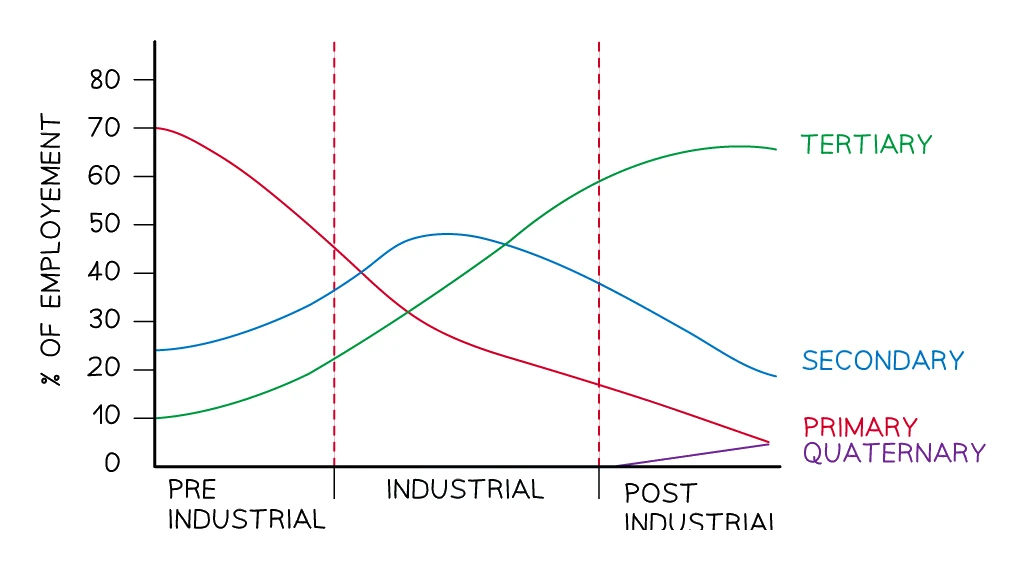
As the graph shows, the primary sector's share of employment falls steadily, the secondary sector rises to a peak in the industrial stage and then declines, and the tertiary sector grows to dominate the most developed (post-industrial) economies.
Exam tip
Analyse: how does a growing tertiary sector raise living standards?
What comes up: A 6-mark Analyse question asks how growth in a country's tertiary (services) sector can increase its living standards.
Write: Each chain of reasoning needs a cause and its effect on wellbeing. (1) Services jobs tend to pay higher wages than primary work, increasing workers' purchasing power and ability to afford more goods, healthcare and education. (2) Growth in education and healthcare services raises human capital directly — workers become more skilled and healthier, which is itself part of a higher HDI. (3) A larger services sector generates higher tax revenue for the government, enabling more public spending on infrastructure, schools and hospitals, raising living standards further. (4) Services such as transport reduce travel time and costs; entertainment services expand leisure options — both improve quality of life beyond just income.
Watch out: Do not stop at "wages rise." The mark scheme rewards each step of the chain — identify the sector change, state the wage or productivity effect, then link it to a specific dimension of living standards (consumption, healthcare, education, leisure).