1. Core practical: investigating the speed of sound
Aim
- Measure the speed of sound in air using two different methods, and compare their accuracy
- The accepted value for the speed of sound in air at ordinary room temperature is about 340 m/s
Method 1: direct timing over a long distance
- Independent variable: the distance d between the source and the listener (m)
- Dependent variable: the time t taken for the sound to travel from source to listener (s)
- Control variables: the same location with no large reflecting walls nearby; the same person doing the clapping; the same person operating the stopwatch
| Equipment | Purpose | Resolution |
|---|---|---|
| Trundle wheel (or 30 m tape measure) | Mark out the distance between source and listener | 0.01 m |
| Two wooden blocks | Snapped together to produce a sharp click | — |
| Stopwatch | Measure the time between seeing the blocks meet and hearing the sound | 0.01 s |
Method:
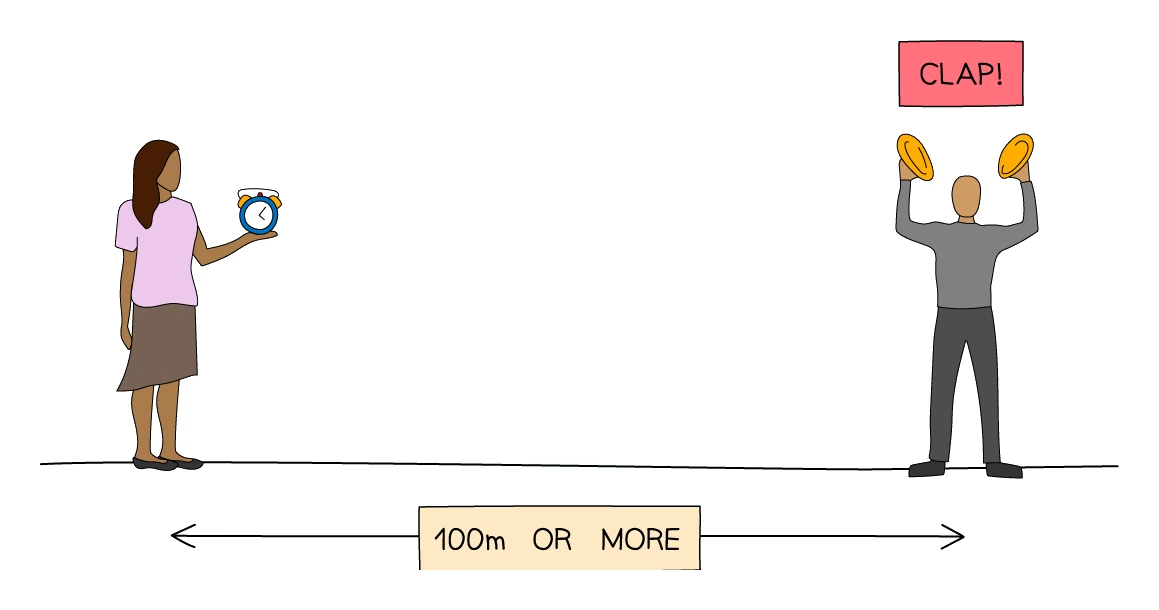
- On open, flat ground with no large walls behind either person, mark out a measured distance (start with about 80 m) between the signaller and the timekeeper
- The signaller raises the two wooden blocks above their head and strikes them together to make a sharp click
- The timekeeper starts the stopwatch the instant they see the blocks meet (light covers 80 m in well under a microsecond, so the sight is effectively immediate) and stops it the moment they hear the click
- Record the time, then repeat the measurement at least three times at the same distance; take the mean
- Move the signaller and timekeeper further apart and repeat the whole procedure for distances of around 110 m, 140 m, 170 m and 200 m
Analysis:
- Calculate the speed of sound from the well-known equation:
speed of sound = distance / mean time
- Compare each distance's result with the accepted value of 340 m/s
Sources of error:
- The main source of inaccuracy is human reaction time, which can be as large as 0.2 s. For sound covering 80 m the travel time is only about 0.24 s, so the reaction time is a serious fraction of the result. Lengthening the distance to 200 m more than doubles the travel time and pushes the reaction error down to a smaller proportion of the total
Method 2: oscilloscope and two microphones
- This method removes the reaction-time error by letting the oscilloscope do the timing
- Independent variable: the distance between the two microphones (m)
- Dependent variable: the time delay between the two pulses on the oscilloscope screen (s)
- Control variables: the same two microphones, the same oscilloscope settings, the same clap-source position
| Equipment | Purpose |
|---|---|
| Two identical microphones | Detect the sound at the two ends of the measured distance |
| Oscilloscope (two-channel) | Display both microphone signals against a shared time base |
| Tape measure | Measure the distance between the two microphones |
| Two wooden blocks | Produce the clap |
Method:
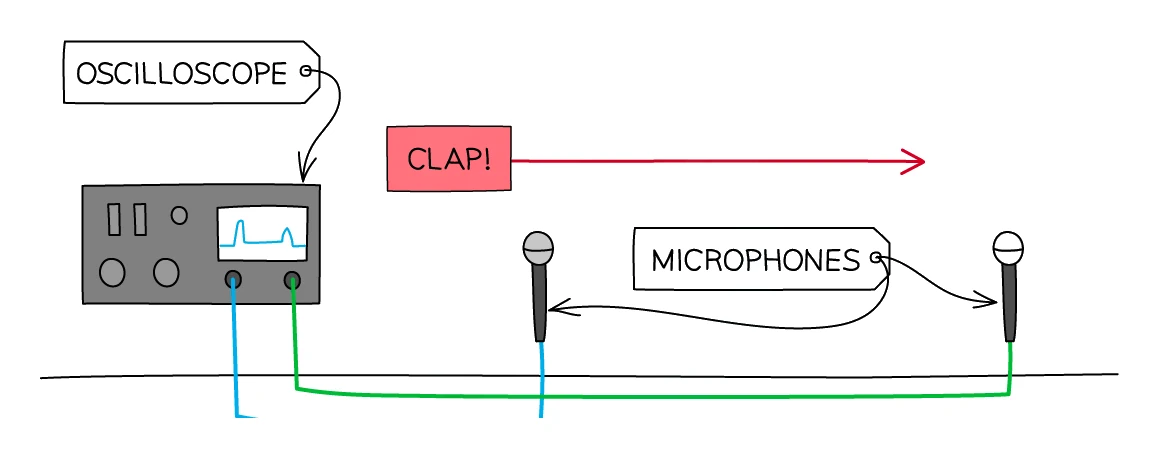
- Connect microphone 1 to channel 1 of the oscilloscope and microphone 2 to channel 2
- Place the two microphones in a straight line, starting about 1.2 m apart on a level surface; measure the separation with the tape
- Set the oscilloscope to trigger from channel 1 and adjust the time base until a single short clap can be seen on both channels with the second pulse a clear distance to the right of the first
- Stand close to microphone 1 (so the time delay starts from a known position) and clap the wooden blocks once
- Freeze the trace, then read off the time gap between the two pulses from the oscilloscope's time base
- Repeat steps 3–5 a further two times at the same separation and take the mean
- Increase the microphone separation to about 1.7, 2.2, 2.7 and 3.2 m and repeat
Analysis:
- For each separation, calculate the speed of sound from:
speed of sound = microphone separation / mean time delay
- Results should cluster around 340 m/s
Common exam question
Describing or evaluating a speed-of-sound investigation
Question: Describe an investigation to find the speed of sound, or evaluate an echo method and explain an improvement (2–5 marks each).
Set in 2 of the 24 papers. A description earns a mark for a viable method (timing over a known distance, or wavelength at a known frequency), a realistic minimum distance (100 m for a clap seen and heard, 50 m for a wall echo, 1 m between microphones), a named instrument, a setup detail (time from seeing to hearing the clap; an echo goes there and back), repeats with an average, and the matching formula. A fully labelled diagram can earn all five.
An evaluation credits human reaction time, no repeats, the distance measurement's accuracy, uncontrolled variables such as wind, and that a longer distance shrinks the timing error's share. Improvements: electronic or data-logged timing with a microphone, and a larger distance. Measure the distance with a trundle wheel or tape, never from the speed of sound.
2. Sound waves and oscilloscopes
What an oscilloscope shows
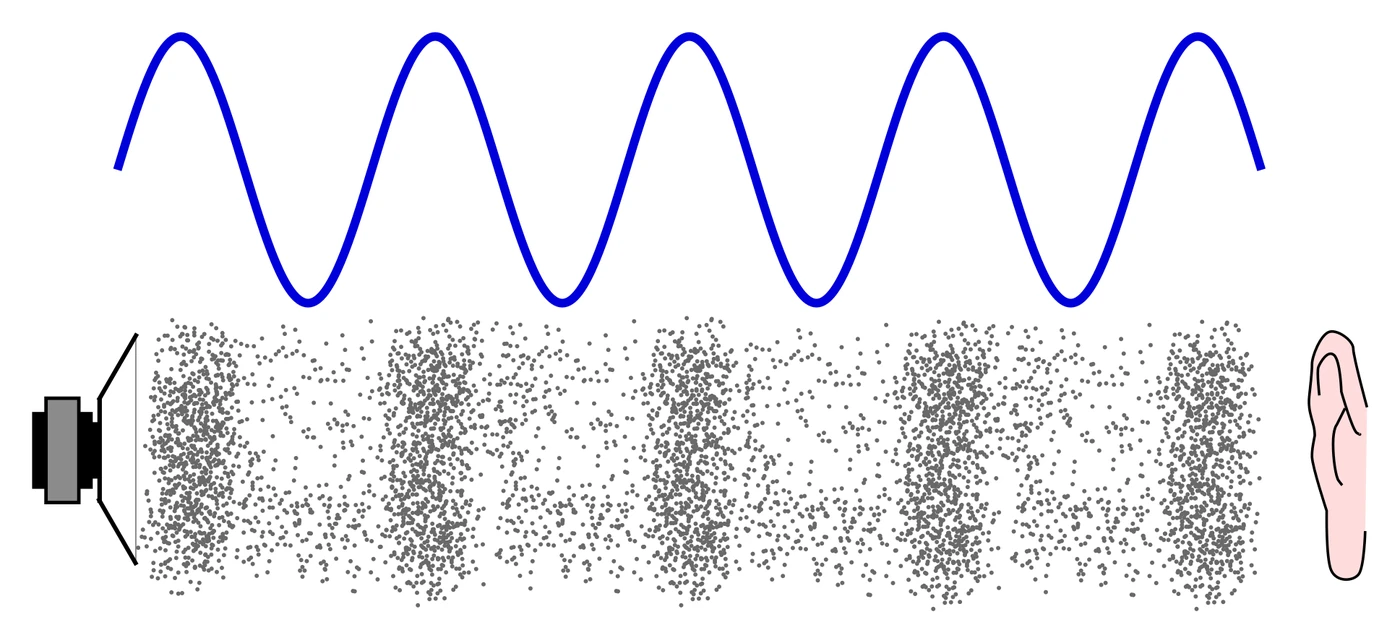
- An oscilloscope is an instrument that draws a graph of a rapidly changing voltage against time
- A microphone converts the longitudinal vibration of air into a varying voltage, so connecting a microphone to an oscilloscope lets you "see" a sound wave on the screen
- The displayed trace looks like a transverse wave, even though the underlying sound is longitudinal, because the screen is plotting voltage (y) against time (x), not the back-and-forth motion of air particles
Common exam question
Naming the detector connected to the oscilloscope
Question: Give the name of the equipment that detects the sound wave for the oscilloscope (1 mark).
Asked in 3 of the 24 papers, always ahead of the parts that read the trace. The answer is microphone: it converts the pressure variations of the sound into a varying voltage, which is what the oscilloscope plots. One scheme lists "sound sensor" and "ultrasound detector" as ignored, so on their own they earn nothing, even when the wave being detected is ultrasound.
Reading the trace
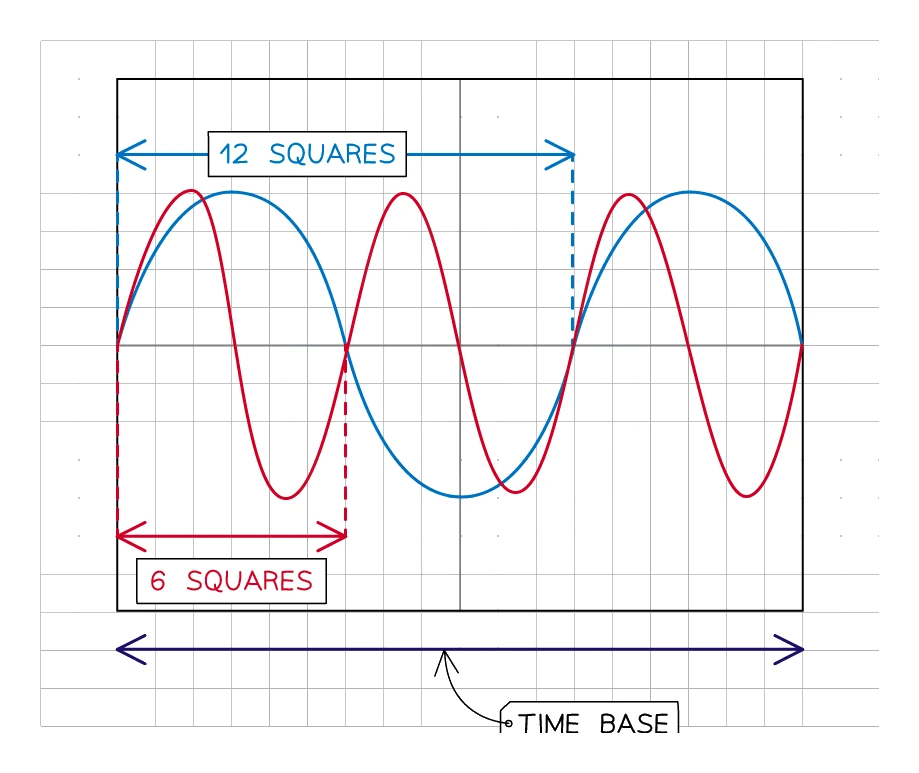
- The time base sets the x-axis: how many milliseconds (or microseconds) correspond to each horizontal division on the screen
- The y-gain sets the y-axis: how many millivolts correspond to each vertical division
- Two quantities are read directly off a frozen trace:
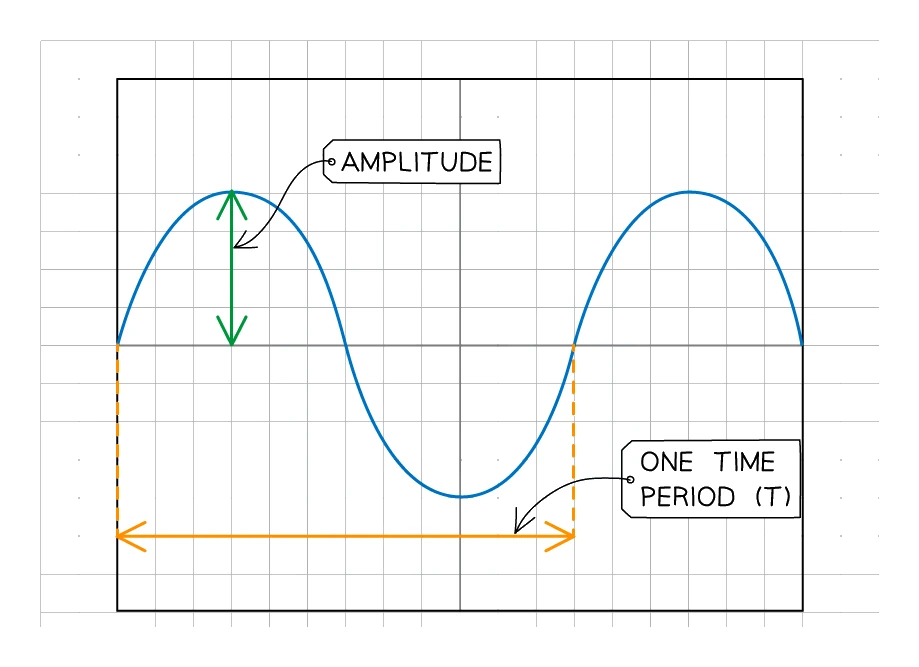
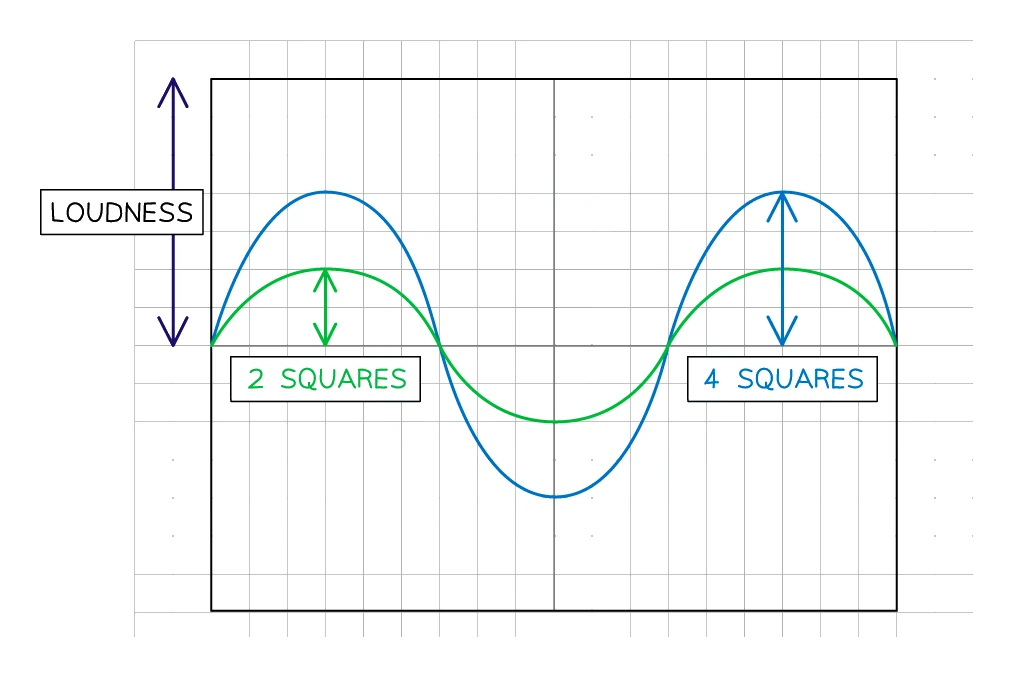
- Amplitude: the vertical height of a peak measured from the centre line; a louder sound gives a taller trace
- Period (T): the horizontal distance between two corresponding points on the wave (peak to peak is easiest); a higher-pitched sound gives a shorter horizontal gap
- Once T is known, the of the sound is f = 1 / T
- A higher-frequency sound fits more wave cycles across the same width of screen
Common exam question
Reading the period and frequency off the trace
Question: Use the trace and the oscilloscope settings to determine the time period of the sound wave, then calculate its frequency (3–5 marks in total).
Asked in 4 of the 24 papers. The first mark is the number of squares for one full cycle, read along the time axis; an answer that clearly uses the amplitude scale scores zero. Measure across all the cycles shown and divide, which is how two of the schemes find the period: one accepts 5.2 to 5.5 squares, another caps a slightly short reading at three of its four marks. The second mark is multiplying by the time base (the time per square), and a wrong square count still earns it if the working is clear. Give the period in seconds, converting from milliseconds. Then f = 1/T earns the remaining mark or marks with error carried forward from your period. A power-of-ten slip costs one mark.
Worked example
Finding frequency from an oscilloscope trace
A sound wave is displayed on an oscilloscope. One full cycle spans 5 squares horizontally, and the time-base is set to 2 ms per division.
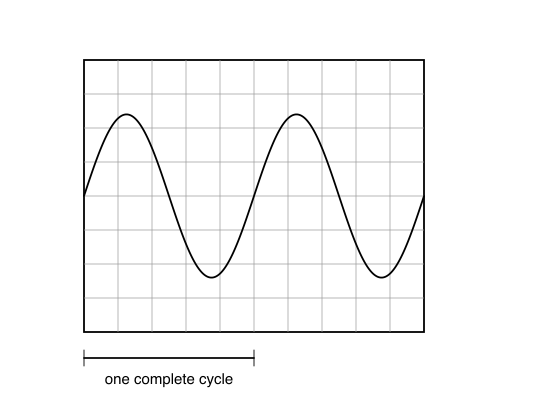
Solution:
- Period: T = 5 × 2 ms = 10 ms = 0.010 s
- Frequency: f = 1 / T = 1 / 0.010 = 100 Hz
3. Core practical: using an oscilloscope to find the frequency of a sound
Aim
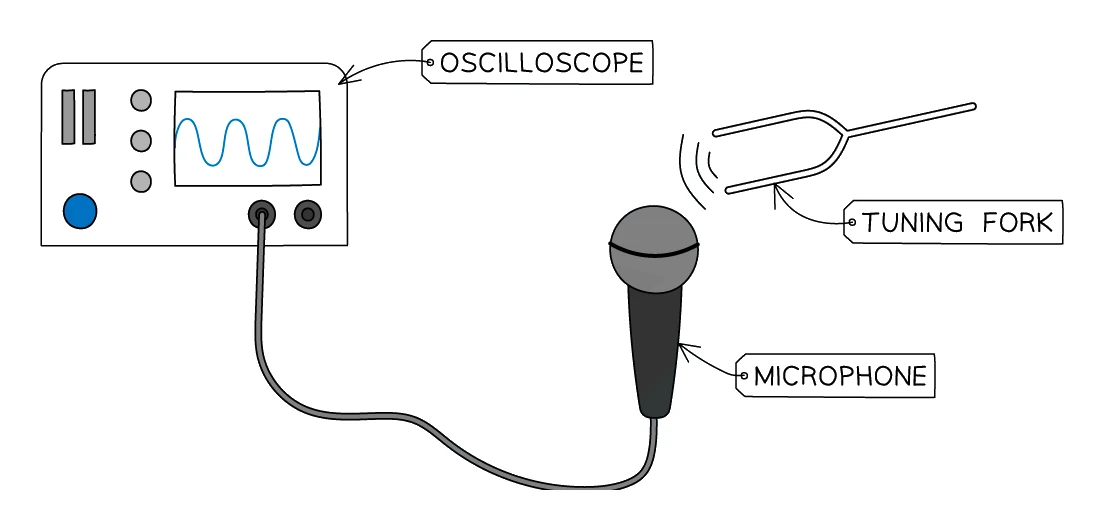
- Measure the of the sound produced by tuning forks of different pitches by reading the period off an oscilloscope screen
Variables
- Independent variable: the tuning fork being used (each fork is stamped with its rated frequency)
- Dependent variable: the period T read from the oscilloscope trace (s), from which the measured frequency is calculated
- Control variables: the same microphone and oscilloscope, the same time-base setting (kept constant during one measurement, and noted so it can be converted), the same fork-to-microphone distance, the same quiet room
Equipment
| Equipment | Purpose |
|---|---|
| Several tuning forks of known frequency | Produce a clean tone at the fork's stamped frequency |
| Rubber striking pad | Strike the fork on something soft to avoid metallic ringing overtones |
| Microphone | Pick up the fork's tone and turn it into a varying voltage |
| Oscilloscope | Display the voltage against time and measure its period |
| Connecting leads | Wire the microphone to the oscilloscope's channel-1 input |
Method
- Connect the microphone to channel 1 of the oscilloscope and switch the oscilloscope on
- Set the time base so that a few full cycles of a typical 400–500 Hz fork will fit across the screen (a starting value of around 0.5 ms per division works well)
- Strike the first tuning fork sharply on the rubber pad and immediately hold it about 5 cm from the microphone
- Freeze the oscilloscope display, or take a quick photograph of the screen, while the trace is steady
- Read off how many horizontal divisions make up one full cycle of the wave by tracking from a peak to the next peak (this gives the cleanest reading)
- Repeat the strike-and-freeze cycle a further two times for the same fork; take the average number of divisions
- Repeat steps 3–6 for the other forks, adjusting the time base if the higher-frequency forks pack too many cycles into the screen
Analysis
- Convert divisions to seconds using the time base:
T = (divisions per cycle) × (time-base scale per division)
- Convert period to frequency:
f = 1 / T
- Compare the measured frequency with the value stamped on the side of the fork
Exam tip
Describing and adjusting the time base
Asked how an oscilloscope measures a period, give three of these four steps: obtain a steady or frozen trace, adjust the time base so at least one full cycle fits the screen, count the squares for one full cycle, and multiply that count by the time base. To show fewer cycles, decrease the time base (less time per square); any mention of the y-axis is ignored. Drawing a trace for a given period, make every cycle the same width, period ÷ time base squares (2.0 ms at 0.50 ms per square is 4 squares); the amplitude is ignored.
Sources of error and safety
- Systematic error, wrong time-base reading. The scale on most oscilloscopes is in milliseconds per division; misreading it as seconds per division throws the answer out by a factor of 1000. Always note the scale at the start of each measurement
- Random error, background noise. Other sounds in the room add fuzz to the trace and make division-counting harder. Carry the practical out in a quiet room and ask others not to talk while a measurement is being taken
- Safety. Strike the fork on a rubber pad rather than a hard surface; striking glass or concrete can chip the fork and send fragments flying
4. Pitch and loudness
Pitch is set by frequency
- The of a sound is how high or low it sounds to the ear
- Pitch is determined by the of the vibrating source:
- A vibration at a high frequency produces a high-pitched (treble) sound
- A vibration at a low frequency produces a low-pitched (bass) sound
- On the oscilloscope: a higher pitch shows more wave cycles in the same horizontal width, and a shorter peak-to-peak distance
Loudness is set by amplitude
- The of a sound is how strong it sounds to the ear
- Loudness is determined by the of the wave (the size of the back-and-forth movement of the air):
- A larger amplitude produces a louder sound
- A smaller amplitude produces a quieter sound
- On the oscilloscope: a louder sound shows a taller wave from the centre line, while a quieter one has a shorter trace
Independence
- Pitch and loudness are independent properties of a sound wave; either can be changed without affecting the other
- A single tuning fork struck softly and then struck hard produces the same pitch each time; the trace keeps the same horizontal spacing but the second strike gives a taller wave
- A flute playing a high note quietly and a tuba playing a low note loudly differ in both pitch and loudness simultaneously, but the two properties are independent in principle
Common exam question
Pitch, loudness and what changes on the trace
Question: State the wave property that determines the pitch of a sound, or draw on the screen the trace of a sound with a lower pitch that is also quieter (1–2 marks).
Set in 2 of the 24 papers. Pitch is set by frequency: write that one word. The scheme ignores a unit but rejects an answer naming more than one quantity, so "frequency and wavelength" scores zero. For the drawing, lower pitch means lower frequency, fewer waves across the screen than the original, and quieter means lower amplitude, shorter peaks than the original; each is a separate mark and must hold for the whole trace. Where the wave sits vertically on the grid is ignored.
5. Range of human hearing
The audible range
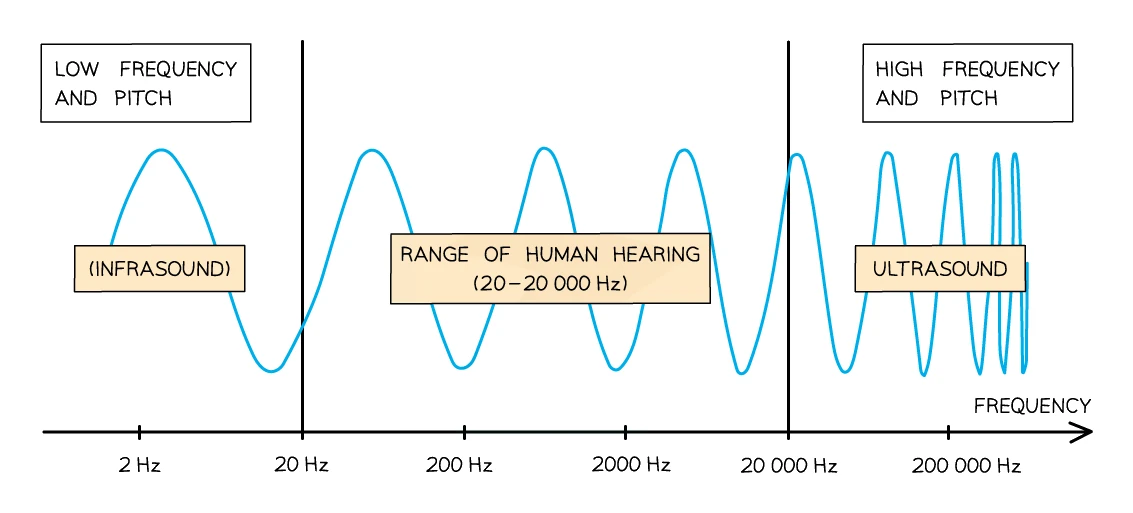
- A healthy young human ear responds to sound waves with frequencies roughly 20 Hz to 20 000 Hz (20 kHz)
- This range narrows with age; older adults often cannot hear above 12–15 kHz, while children may still hear close to the full upper limit
- Many other animals have very different ranges:
- dogs hear up to about 45 kHz (which is why high-frequency dog whistles work)
- bats hear and emit sounds up to roughly 120 kHz for echolocation
- elephants and whales can produce and detect frequencies well below 20 Hz
Common exam question
Stating the range of human hearing
Question: State the frequency range of human hearing, tick the frequencies in a table that a human can hear, or explain which bar of a chart belongs to a human (2 marks).
Asked in 3 of the 24 papers. One mark for each limit: 20 Hz and 20 000 Hz (20 kHz is accepted). Any unit must be a frequency unit matching the number; a non-frequency unit caps the answer at one mark. In a table, ticking only the middle values (500 Hz and 2000 Hz) earns one mark; the second needs 30 Hz and 10 000 Hz ticked as well, and a tick against 10 Hz or 25 000 Hz scores zero. On a bar chart of animals' maximum frequencies, the human is the bar reaching 20 kHz, because humans hear up to 20 kHz; a qualification that the upper limit falls with age or hearing loss is accepted.
Below the range: infrasound
- Infrasound is sound with a frequency below 20 Hz, too low for the human ear
- Sources of infrasound include earthquakes, volcanic activity, large explosions, and slow-rotating industrial machinery
- The body sometimes detects infrasound as a feeling of vibration in the chest rather than as a heard tone
Above the range: ultrasound
- Ultrasound is sound with a frequency above 20 000 Hz, too high for the human ear
- Common uses of ultrasound include medical scanning (prenatal scans, scans of internal organs), industrial cleaning of delicate parts, sonar in ships and submarines, and animal-distance sensors
- Ultrasound is covered in more detail in later topics
Worked example
Depth of the seabed from a sonar echo time
A sonar emitter on a boat sends out a pulse of sound. The pulse travels down to the seabed and the reflected echo is detected 0.40 s after the pulse was sent. The speed of sound in sea water is 1500 m/s. Calculate the depth of the water.
Solution:
- Total distance travelled by the pulse (there and back): d = speed × time = 1500 × 0.40 = 600 m
- The pulse travels down and back, so depth = 600 ÷ 2 = 300 m
The factor of 2 is a mark of its own. In two four-mark echo questions an answer without it was left with three marks, and in a three-mark speed-of-sound echo question using the one-way distance was left with two; halving the time instead of the distance is accepted.