1. Distance-time graphs
Reading the shape of the line
- A distance-time graph plots the distance an object has travelled from a starting point (y-axis) against the time it has been moving (x-axis)
- The shape of the line tells you how the speed of the object is behaving at any moment
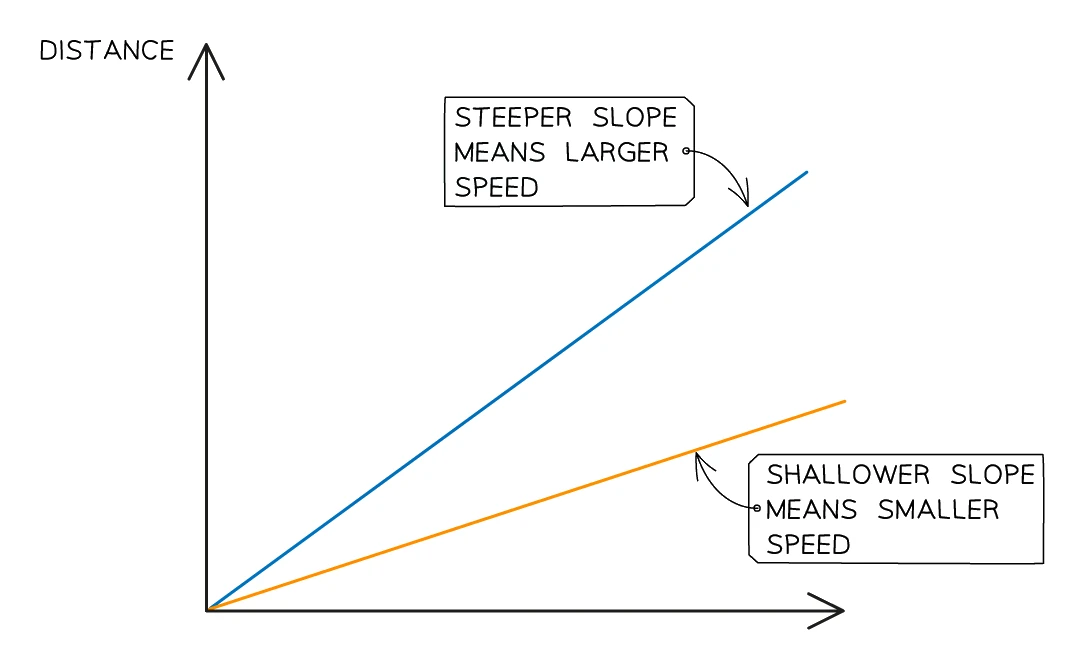
- For a section where the object travels at a constant speed:
- A straight line on the graph is the signature of a fixed speed
- The steeper the line, the faster the constant motion
- A line with only a slight tilt corresponds to a slow, plodding motion
- A perfectly horizontal line signals that the object is at rest, because its distance from the start is not changing
- For a section where the speed is changing:
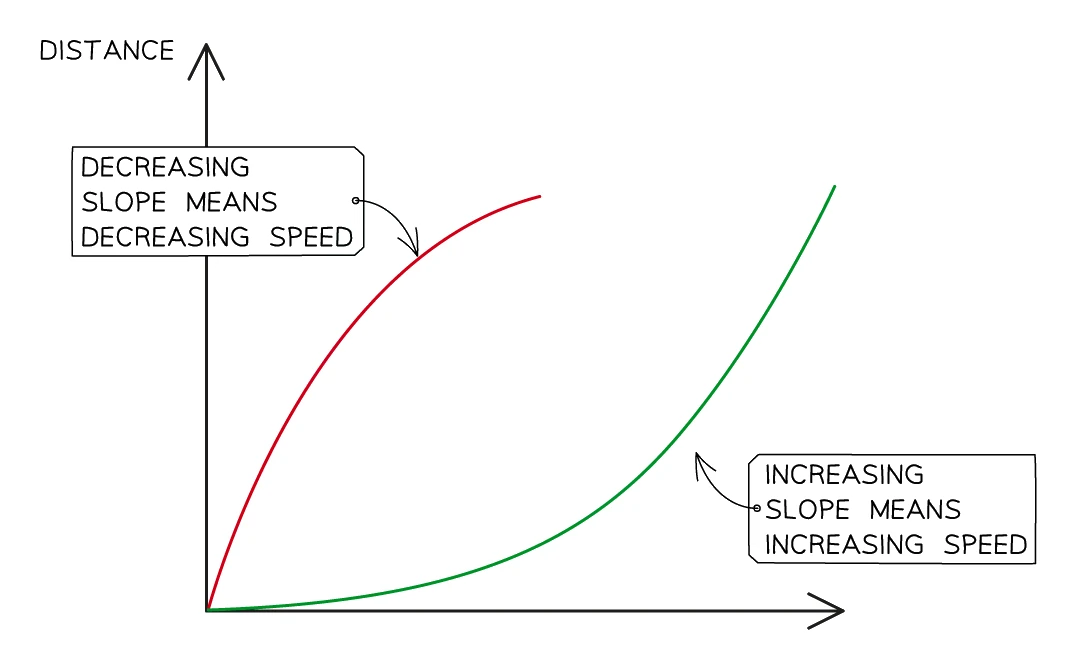
- A curved line is the signature of a changing speed
- A curve that gets steeper over time means the object is speeding up (accelerating)
- A curve that flattens out over time means the object is slowing down (decelerating)
Calculating speed from the gradient
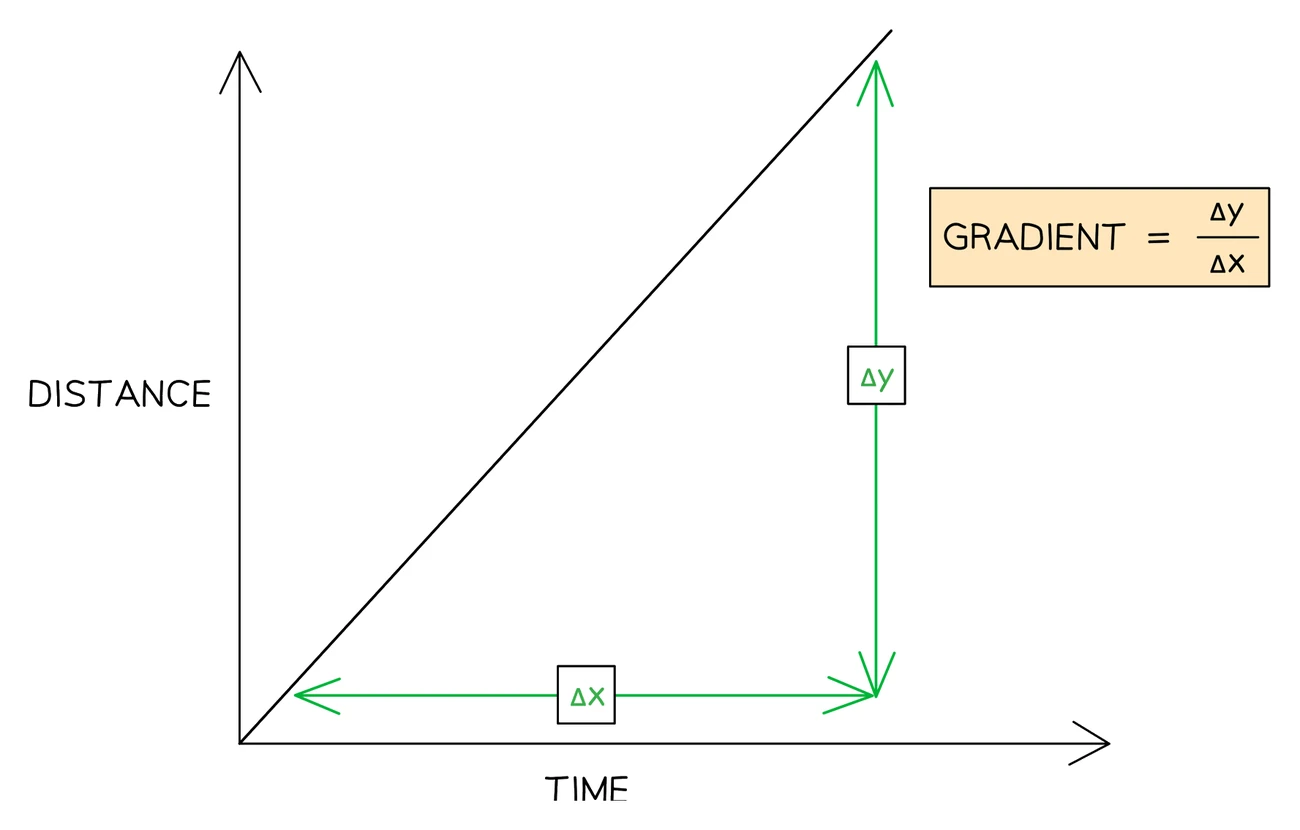
- The at any point on a distance-time graph equals the of the line at that point:
speed = gradient = Δy / Δx = (change in distance) / (change in time)
- For a straight-line section, the gradient is the same everywhere, so pick two convenient points well apart on the line, read off the change in distance and the change in time, and divide
- For a curved section, the slope keeps changing, so the gradient at one instant is the slope of the tangent at that point
- Drawing a large gradient triangle across the longest available straight section gives the smallest read-off uncertainty, because small triangles magnify the error of each axis reading
Common exam question
Explaining how a distance–time graph shows acceleration
Question: Explain how the gradient of a distance–time graph shows that an object is accelerating, or that its speed is changing (3 marks).
Asked in 2 of the 24 papers, both times about a curved line, and the three marks are three separate statements, so make all of them. The gradient of a distance–time graph is the speed; the gradient is changing (increasing, because the curve gets steeper); so the speed is changing (increasing, for an object that speeds up). Writing only "the line is a curve" is risky: one scheme accepted it for the changing gradient, but the other wanted the gradient increasing (or the curve getting steeper) and gave the curve statement one mark only when nothing else scored.
For an object vibrating on a spring, you can describe how the speed varies instead: zero at the turning points, where the curve is flat, and greatest where the curve is steepest.
Worked example
Calculating speed from a distance–time graph
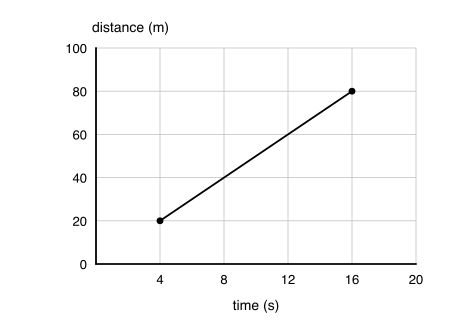
An object moves along a straight track. On the distance–time graph for the journey, the line rises from 20 m at t = 4 s to 80 m at t = 16 s.
Solution:
- Change in distance: 80 − 20 = 60 m
- Change in time: 16 − 4 = 12 s
- Speed = change in distance ÷ change in time = 60 ÷ 12 = 5 m/s
2. Speed
What speed measures
- Speed is the distance an object travels each second
- Speed is a scalar quantity: it has a magnitude (a numerical size) but no direction
- The SI unit is metres per second (m/s); other units include km/h and mph for everyday contexts
- An object's speed is rarely truly constant from second to second; in most real journeys the instantaneous speed drifts as the motion progresses
Average speed
- smooths the whole journey into one figure that ignores the moment-by-moment variation:
average speed = (total distance moved) / (total time taken)
- The same equation rearranges two ways:
- distance = average speed × time
- time = distance / average speed
Common exam question
Stating and using the average speed equation
Question: State the equation that links average speed, distance moved and time taken, then use it to calculate a speed, a distance or a time (1 mark, then 2–3 marks).
The equation is asked for in 3 of the 24 papers. Write average speed = distance moved ÷ time taken; standard symbols and any correct rearrangement are accepted, and the schemes allow s or d for distance and v or s for speed. The calculation gives one mark for the substitution (or the rearrangement, when the unknown is the distance or the time) and one for the evaluation, so show the substitution.
When a speed limit is in km/h or the data are in miles per hour, converting is a mark in itself: multiply the miles by the metres-per-mile factor given and divide by 3600 to reach m/s, or convert your m/s answer into km/h. Either direction is accepted when the conversion is shown and your conclusion matches your numbers.
3. Core practical: investigating motion
Aim
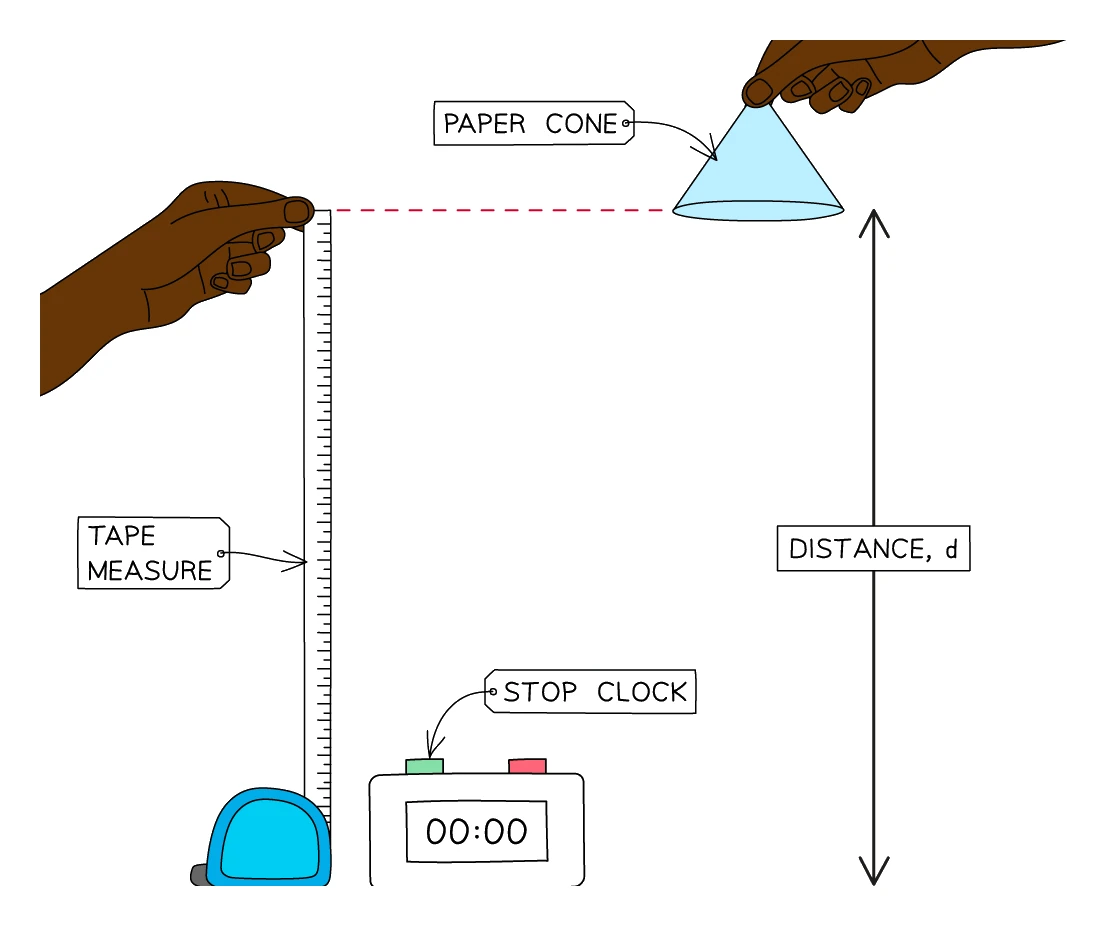
- Measure the of an everyday falling object by timing how long it takes to fall through a known distance
- Suitable objects: a paper cone, a ping-pong ball, a small ball of cotton wool. The object must be light enough that air resistance keeps the speed slow enough to time by hand
Variables
- Independent variable: drop height, d (in m)
- Dependent variable: time taken to fall, t (in s)
- Control variables: the same object used in every drop, released from rest, dropped from the same starting position with the room's air kept still
Apparatus
| Equipment | Purpose | Resolution |
|---|---|---|
| Metre rule (or longer tape) | Mark out the drop heights | 1 mm |
| Stopwatch | Time each fall | 0.01 s |
| Falling object (paper cone or ball) | The motion to be investigated | — |
Method
- Mark a starting drop height of 0.5 m above the landing point using a metre rule clamped to a retort stand
- Hold the object level with the mark, with the stopwatch ready in your other hand
- Release the object from rest and start the stopwatch the instant it leaves your fingers
- Stop the stopwatch as soon as the object touches the mat; record the time
- Repeat the drop a further two times from the same height; take the mean of the three readings
- Repeat steps 1–5 from heights of 0.9 m, 1.3 m, 1.7 m and 2.0 m
Common exam question
Describing how to measure the speed of a moving object
Question: Describe a method to determine the speed of a vehicle passing two markers a known distance apart, or of a marble rolling across a bench (3 marks).
Set in 2 of the 24 papers. For the marble the three marks were the distance, the time and the equation; for the markers, a known distance apart, they were the time, the instrument and the equation, so make all four points. Say that the distance is known or measured (between the markers, or along the bench), say that the time taken to cover it is measured and name the instrument (a stopwatch, a stop clock or light gates), then say that the speed is calculated as distance ÷ time; any subject of the equation is accepted. Light gates connected to a data logger are credited as the alternative route: position them so that the object cuts the beams, and the timing then starts and stops without a person's reaction time.
Analysis
- For each drop height, calculate the from:
average speed = drop height / mean time
- A taller drop gives a longer fall time and a larger average speed, because gravity has more distance over which to speed the object up
- Plotting average speed against drop height shows whether the relationship is linear or curved within the experimental range
Common exam question
Testing whether results fit distance = constant × time²
Question: Use the data in the table to deduce whether the results support the relationship distance ÷ time² = constant (3–4 marks).
Set in 2 of the 24 papers, both times for a ball rolling down a slope. Work out distance ÷ time² for two different rows of the table, showing each division and its value; then compare the two values in a sentence or an expression, and give the conclusion that follows from your comparison. The marks are one for each constant, then one or two for the comparison and the conclusion, and on the four-mark version the comparison mark was allowed even when the two values came out unequal, with the conclusion mark for a verdict consistent with that comparison. Use the table's numbers: constants worked out from a graph were ignored.
Sources of error
- Systematic error, reaction time. A human takes roughly 0.25 s to start the stopwatch and another 0.25 s to stop it; that is a sizeable fraction of a 0.5 s fall. Reduce this either by using longer drops (so reaction time is a smaller percentage of the total) or by replacing the stopwatch with light gates wired to a trapdoor release, which starts and stops the timer automatically
- Systematic error, parallax. When you set each drop height, line your eye up squarely with the mark so the reading is not skewed by viewing the scale from above or below
- Random error, air movement. Even a small draught will deflect a paper cone or cotton ball mid-fall; close doors and windows and ensure nobody is walking past during a drop
Safety
- Place a soft mat or padded tray at the landing point so the falling object does not bounce, break or roll into walkways
4. Acceleration
Definition and equation
- Acceleration is the rate of change of velocity, that is, how much the velocity changes each second
- Equation:
a = Δv / t = (v − u) / t
- where:
- a = acceleration in metres per second squared (m/s²)
- u = initial velocity (m/s)
- v = final velocity (m/s)
- t = time over which the velocity changes (s)
- The units of acceleration, m/s², come from "change in m/s, per s", because the velocity changes by a metres per second every second
Sign of the acceleration
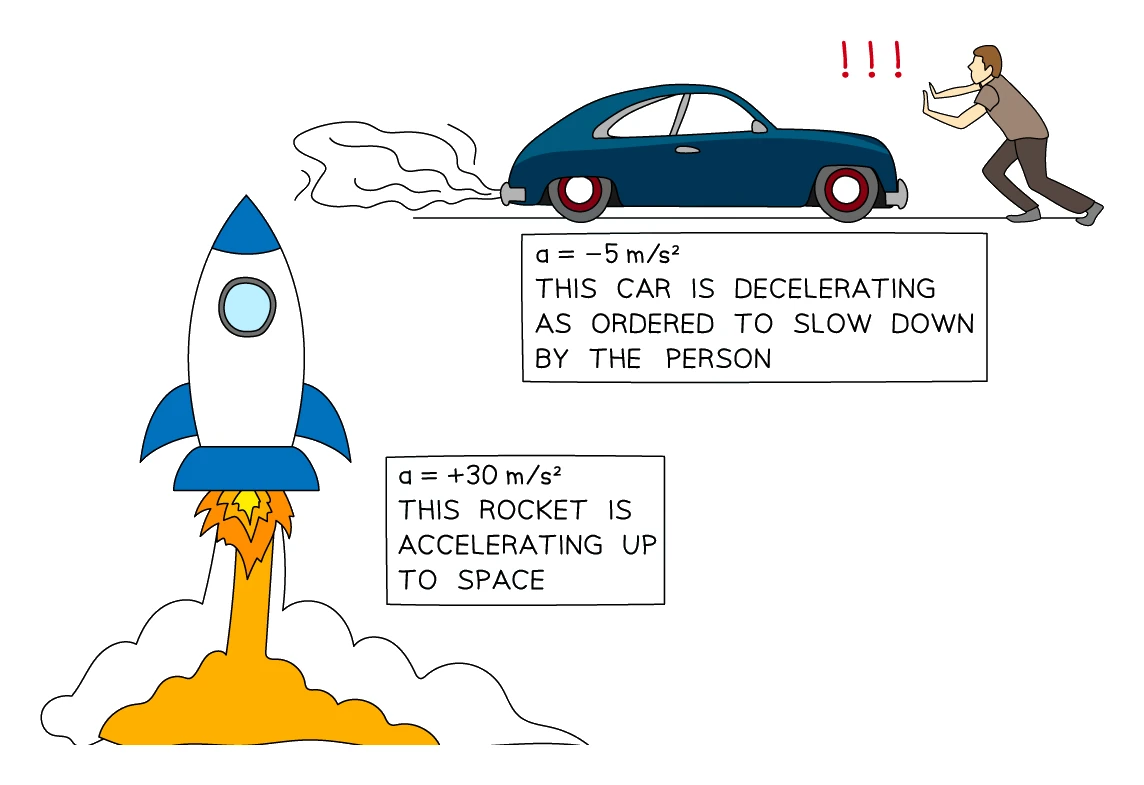
- If the calculated value of a comes out positive, the object is gaining speed in the direction it is already moving (it is accelerating)
- If the calculated value of a comes out negative, the object is losing speed; this is called a deceleration
- The sign therefore carries physical meaning, because a minus sign in front of an acceleration is the maths telling you the motion is slowing
Worked example
Finding acceleration from a velocity–time graph
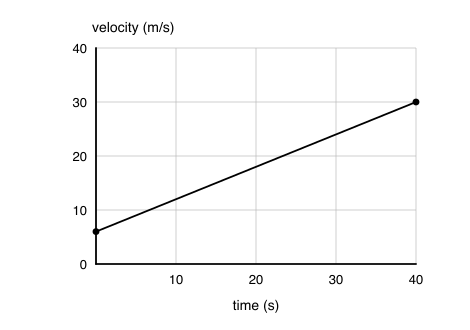
A straight line on a velocity–time graph passes through the point (6 m/s, t = 0) and rises to (30 m/s, t = 40 s).
Solution:
- Change in velocity: 30 − 6 = 24 m/s
- Time interval: 40 s
- Acceleration = change in velocity ÷ time = 24 ÷ 40 = 0.6 m/s²
5. Velocity-time graphs
Reading the slope
- A velocity-time graph plots an object's velocity (y-axis) against the time elapsed since the start of the motion (x-axis)
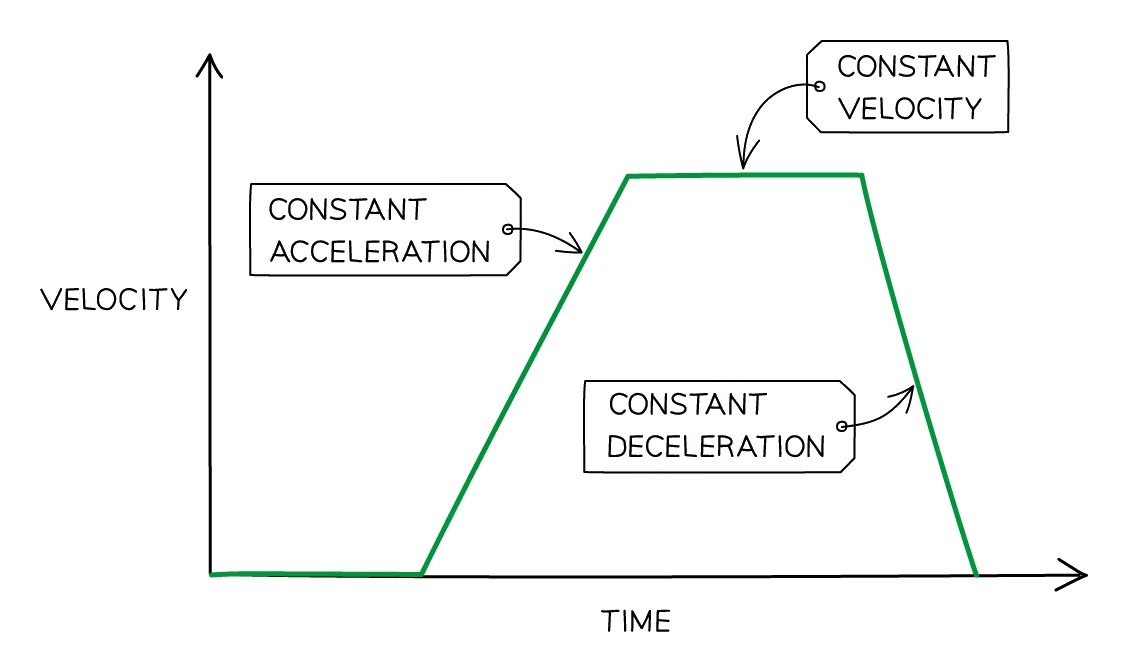
- The slope of the line tells you about the acceleration:
- A straight line with a positive gradient means constant acceleration, with velocity climbing at a steady rate
- A straight line with a negative gradient means constant deceleration, with velocity falling at a steady rate
- A steep line signals a large magnitude of acceleration; a gentle line signals a small one
- A flat horizontal line means zero acceleration, so the velocity stays at a single fixed value (a constant velocity)
Gradient = acceleration
- The of an object equals the of its velocity-time graph:
a = Δy / Δx = Δv / Δt
- For a straight-line section, the gradient is the same everywhere, so draw a large gradient triangle and divide the rise by the run, taking care to read the axes in their stated units (m/s and s)
Common exam question
Acceleration from the gradient of a velocity–time graph
Question: Use the velocity–time graph to calculate the acceleration, or determine it by drawing a tangent to a curved line (3–4 marks).
Asked in 7 of the 24 papers. The three marks are the idea that acceleration = gradient (or the acceleration equation), stated or clearly used; a substitution with values read from the line, any two points on it with the matching time interval; and the evaluation, in the graph's units (cm/s gives cm/s²). For a curve, draw a tangent at the stated time and take its gradient; the tangent attempt is a mark on its own and the answer is accepted within a range.
A falling velocity gives a negative gradient: one scheme for a braking car ignored the sign, but one for an object thrown upwards rejected a positive answer, so keep the minus sign.
Explaining a constant acceleration needs both points: the gradient is the acceleration, and it is constant. The area gives the distance.
6. Area under a velocity-time graph
What the area means
- The area enclosed between a velocity-time line and the time axis equals the distance that has been covered during the interval (or, equivalently, the magnitude of the displacement if the motion runs in a single direction)
- This is true because area = velocity × time on every thin vertical strip under the line, and velocity × time = distance moved in that strip
Splitting a multi-stage motion into shapes
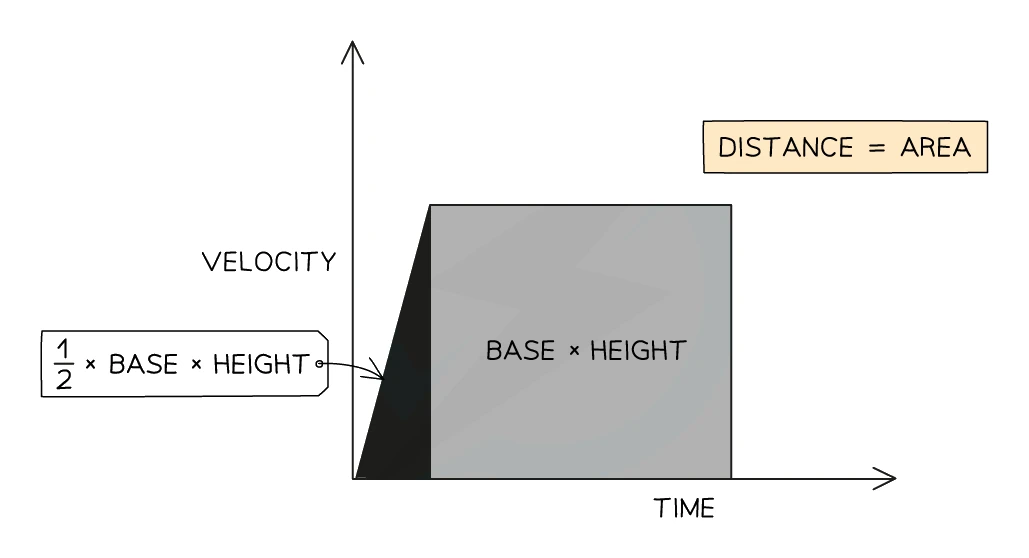
- A constant-velocity section is a horizontal line, so the area under it is a rectangle:
rectangle area = base × height
- A section of constant acceleration or deceleration is a straight slope, so the area under it (down to the time axis) is a triangle:
triangle area = ½ × base × height
- A section that combines a non-zero starting velocity with an acceleration gives a trapezium; split it into a rectangle and a triangle and add the two
- The total distance for a multi-stage motion is found by adding together the area of every enclosed region one stage at a time
Common exam question
Distance from the area under a velocity–time graph
Question: Calculate the distance travelled, or the braking distance, over a stated interval of a velocity–time graph, or show that it has a given value (3–5 marks).
Asked in 6 of the 24 papers. The first mark is for the idea that distance = area under the line, stated or implied by your working. The method marks are then the shapes: a triangle (½ × base × height) under a sloping section and a rectangle under a flat one, added together; for a curve, count the squares or split the area into trapeziums, and the answer is accepted within a range.
Take the area only over the interval asked for. A braking distance is the triangle under the deceleration alone: adding the rectangle for the reaction time gives the whole stopping distance and lost a mark. Using v² = u² + 2as with the acceleration from the earlier part is accepted as an alternative, with follow-through on that value.
Worked example
Finding distance from the area under a velocity–time graph
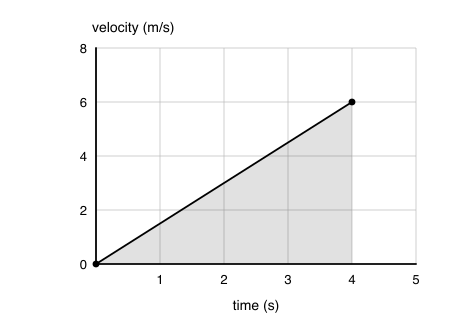
A velocity–time graph shows an object accelerating uniformly from rest (0 m/s) to 6.0 m/s over 4.0 s, then the recording stops.
Solution:
- The region under the line is a triangle (straight slope from zero)
- Area of triangle = ½ × base × height = ½ × 4.0 × 6.0
- Distance = 12 m
7. Calculating uniform acceleration
When to reach for v² = u² + 2as
- Uniform acceleration means the acceleration is constant throughout the motion
- When you know any three of (initial speed, final speed, acceleration, distance) but not the time, the following equation links them in one line:
v² = u² + 2as
- where:
- u = initial speed (m/s)
- v = final speed (m/s)
- a = acceleration (m/s²)
- s = distance moved (m)
- All four quantities must be in SI units before substituting
Common exam question
Using v² = u² + 2as when the time is not given
Question: Calculate a speed after a fall from rest, a distance needed to slow down, or an acceleration over a braking distance, with no time given (3–4 marks).
Set in 8 of the 24 papers. The marks are substitution, rearrangement and evaluation, so substitute before you rearrange. Square the speeds before subtracting: subtracting the two speeds, or using change in speed × time, was rejected as wrong physics. "From rest" means u = 0 and "comes to rest" means v = 0; one scheme credited u = 0 and refused the substitution mark for v = 0. A deceleration is substituted as negative; the sign of the final answer is ignored. For free fall use g = 10 m/s², as the paper says (9.8 or 9.81 is also accepted). From a stopping-distance graph, use the braking distance, not the whole stopping distance; and when a number of significant figures is asked for, that rounding is a separate mark.
Rearranging without a triangle
- Formula triangles only work for simple multiply/divide equations; v² = u² + 2as contains a square and a sum, so triangles are no help
- Use ordinary algebra: subtract u² from both sides, divide both sides by 2a, or take a square root, depending on which letter is the subject. Whatever you do to one side, do to the other
Worked example
Using v² = u² + 2as to find braking distance
A vehicle travelling at 20 m/s brakes to rest with a deceleration of 5 m/s². Find the braking distance.
Solution:
- Identify known quantities: u = 20 m/s, v = 0 m/s, a = −5 m/s²
- Substitute into v² = u² + 2as: 0² = 20² + 2 × (−5) × s
- Rearrange: 2 × 5 × s = 400, so s = 400 ÷ 10
- Distance = 40 m