1. What makes a histogram different
Area, not height
- A histogram displays grouped continuous data, usually in class intervals of unequal width
- It looks like a bar chart but behaves differently in two ways that decide every question
- The bars touch, with no gaps, because the data is continuous
- The area of a bar gives the frequency, not its height
- The vertical axis is labelled frequency density, which the syllabus states directly
- Because area carries the meaning, a histogram cannot be read at a glance the way a bar chart can: some calculation is always needed
| Bar chart | Histogram | |
|---|---|---|
| Data | discrete or categorical | continuous, grouped |
| Class widths | equal | usually unequal |
| Bars | separated by gaps | touching |
| Vertical axis | frequency | frequency density |
| Frequency shown by | the height | the area |
- Where every class happens to be the same width, the heights are in proportion to the frequencies, but the syllabus still labels the vertical axis frequency density
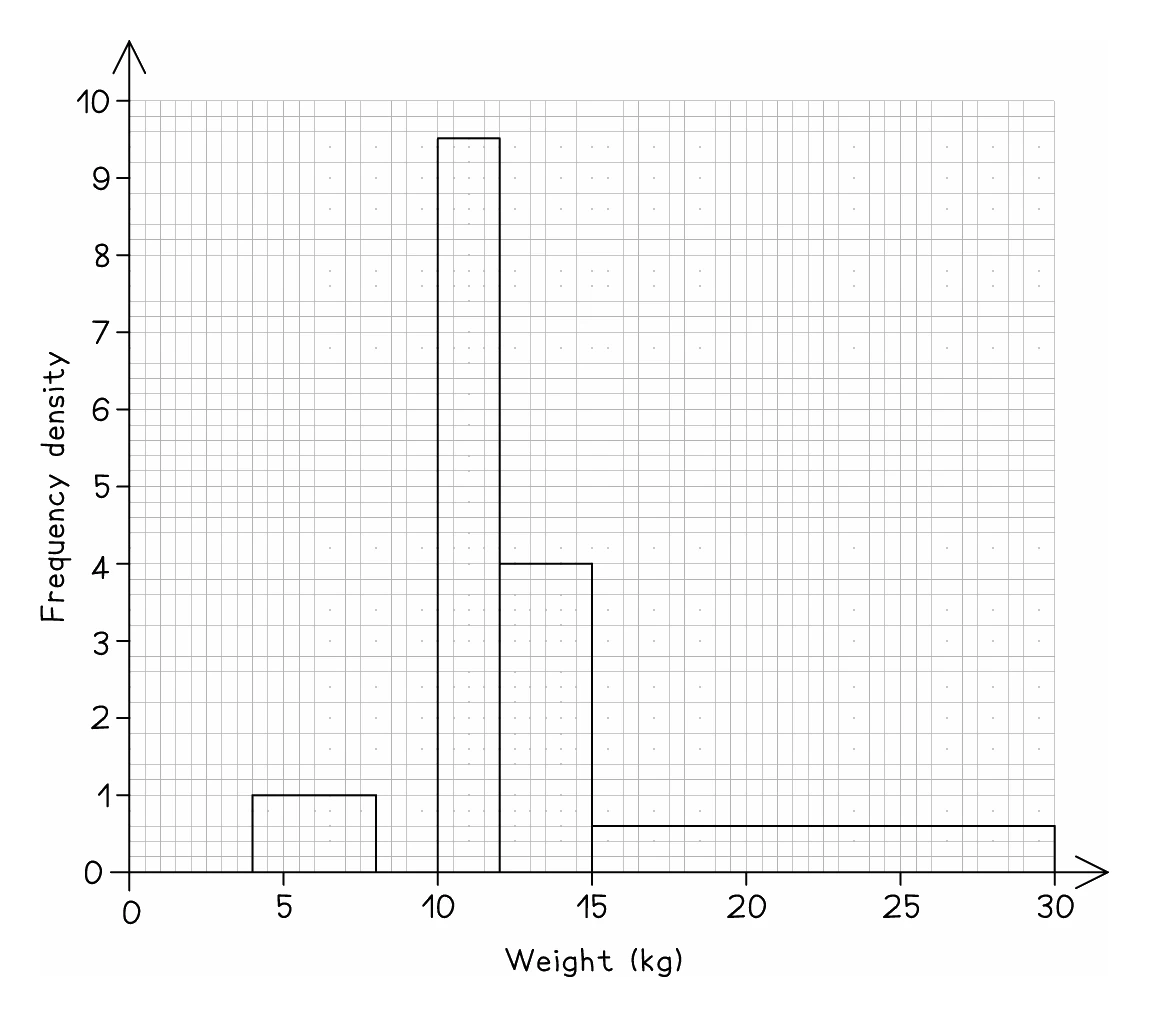
2. Frequency density
The formula both ways
- The syllabus gives the definition: frequency density = frequency ÷ class width
- Rearranged, that gives the reverse reading: frequency = frequency density × class width
- The class width is the upper bound minus the lower bound of the interval
- Set the work out in a table with two extra columns, one for the class width and one for the frequency density
- Write the division in each cell rather than only the answer, since that is what shows the method
Worked example
Frequency densities from a table
The table records the mass m grams of 110 items. Find the frequency density of every class.
| Mass (m grams) | 0 < m ⩽ 20 | 20 < m ⩽ 30 | 30 < m ⩽ 50 | 50 < m ⩽ 80 |
|---|---|---|---|---|
| Frequency | 24 | 35 | 30 | 21 |
Solution:
- Find each class width first, then divide the frequency by it
| Mass (m g) | Frequency | Class width | Frequency density |
|---|---|---|---|
| 0 < m ⩽ 20 | 24 | 20 | 24 ÷ 20 = 1.2 |
| 20 < m ⩽ 30 | 35 | 10 | 35 ÷ 10 = 3.5 |
| 30 < m ⩽ 50 | 30 | 20 | 30 ÷ 20 = 1.5 |
| 50 < m ⩽ 80 | 21 | 30 | 21 ÷ 30 = 0.7 |
- Compare the second and third classes: 35 items against 30, almost the same count, yet the second bar is more than twice as tall because those 35 are squeezed into a width of 10 while the 30 are spread across 20
3. Drawing a histogram
From a table
- Work out every frequency density before touching the graph
- Draw each bar with its width along the horizontal axis and its height equal to the frequency density
- The bars sit edge to edge with no gaps
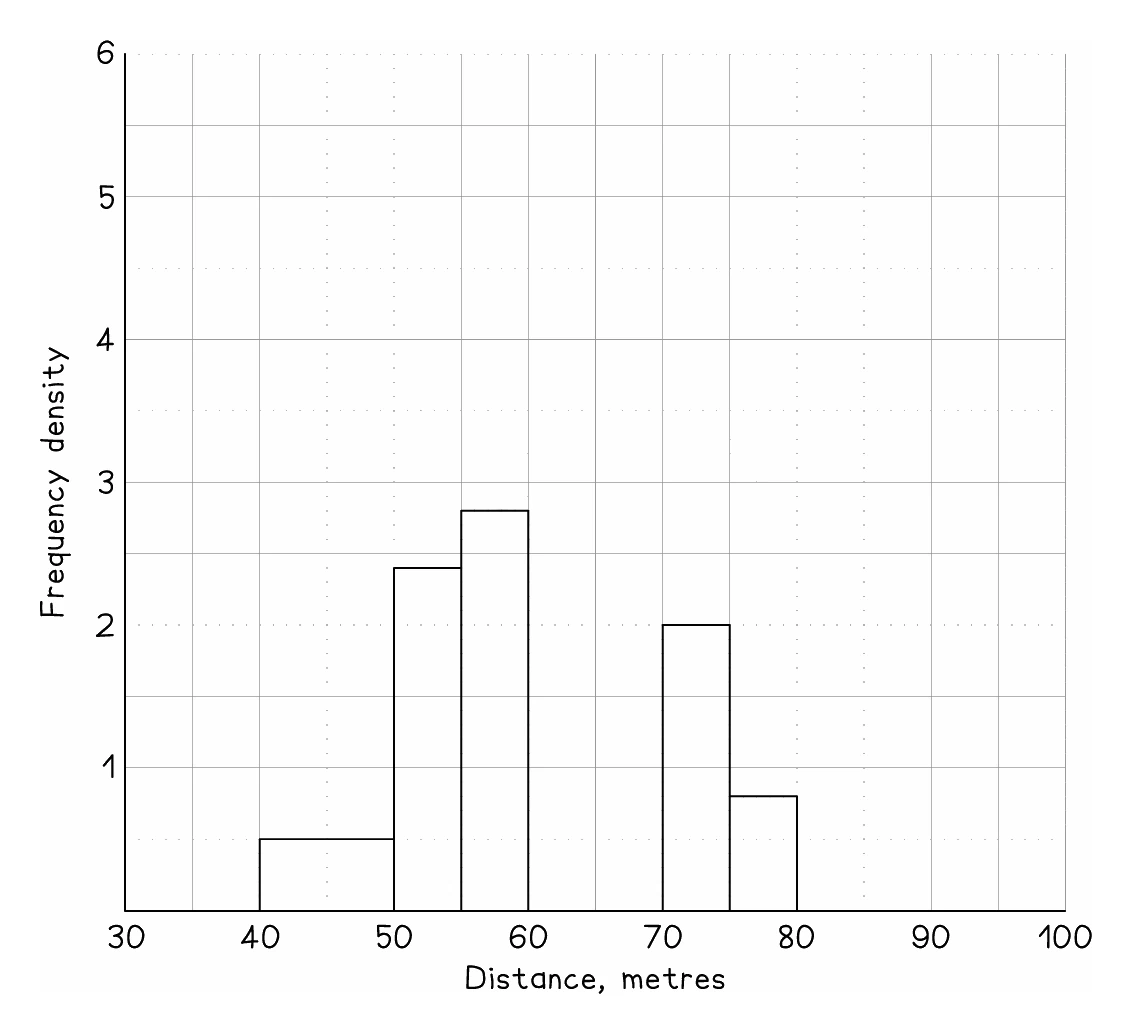
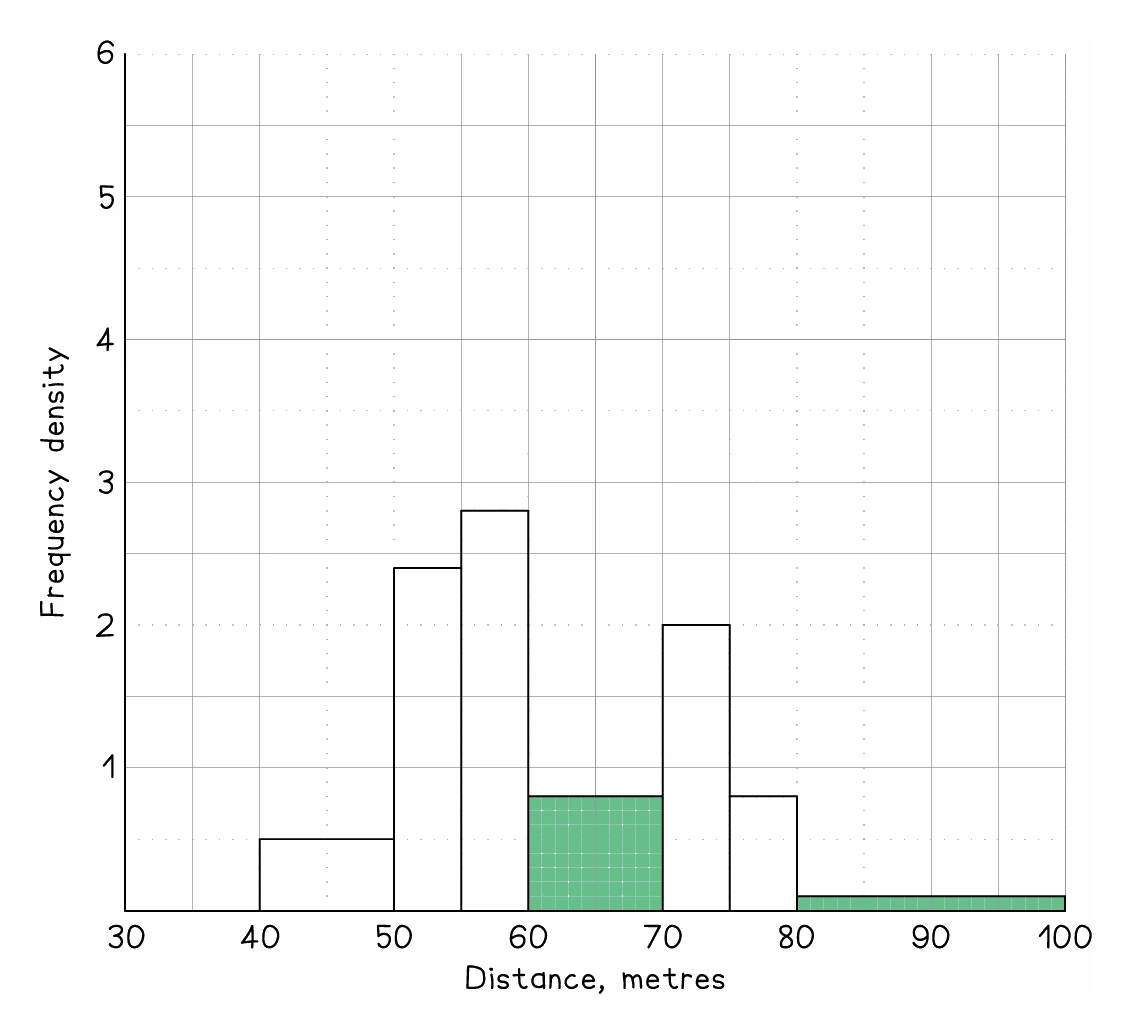
- Questions usually give a partly-drawn histogram and ask you to complete it, rather than starting from blank axes
- Read the scale on the frequency density axis carefully, since one square is rarely one unit
Worked example
Completing a histogram
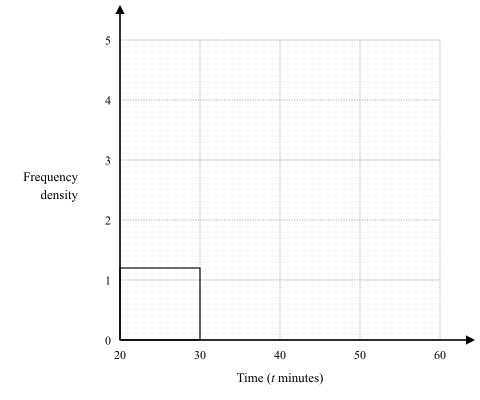
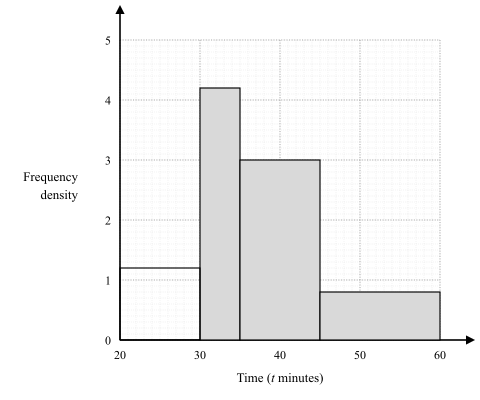
The table shows the times, t minutes, taken by 75 runners to finish a fun run. On a histogram of this data, the bar for 20 < t ⩽ 30 is already drawn at a frequency density of 1.2. Complete the histogram.
| Time (t minutes) | 20 < t ⩽ 30 | 30 < t ⩽ 35 | 35 < t ⩽ 45 | 45 < t ⩽ 60 |
|---|---|---|---|---|
| Frequency | 12 | 21 | 30 | 12 |
Solution:
- Check the bar already drawn first: 12 ÷ 10 = 1.2, which matches its height
- 30 < t ⩽ 35 has width 5, so its frequency density is 21 ÷ 5 = 4.2
- 35 < t ⩽ 45 has width 10, so its frequency density is 30 ÷ 10 = 3
- 45 < t ⩽ 60 has width 15, so its frequency density is 12 ÷ 15 = 0.8
- Draw the three bars edge to edge: from 30 to 35 at height 4.2, from 35 to 45 at height 3 and from 45 to 60 at height 0.8
- With 10 small squares to each unit of frequency density, the top of the first new bar is 2 small squares above the 4 line, and the top of the last is 8 small squares above zero
Exam tip
Show every frequency density before you draw
Drawing a histogram or finding its bar heights in centimetres is set in 8 of the 21 papers. Write each frequency density (frequency ÷ class width) in your working before you draw or scale anything. The marks go on correct bars or heights, but if none of yours is right, every one of those schemes still gives a mark for correct frequency densities, so leave them where the examiner can see them.
When no frequency density scale is given
- A variant gives the height of one bar in centimetres and asks for the heights of the others
- Heights are proportional to frequency density, so find the scale from the bar you are given, then apply it
- If a class with frequency density 3.5 is drawn 7 cm tall, then 1 unit of frequency density is 2 cm
- A class with frequency density 1.2 is then drawn 2 × 1.2 = 2.4 cm tall
- The method is identical; only the units on the vertical axis change
4. Reading a histogram
Back to frequencies
- Going the other way, multiply each bar's frequency density by its class width to recover the frequency
- A question gives the histogram and asks for the frequency of a class, sometimes by filling in a table
- Add the frequencies to find the total number of items where the question needs it
Part of a bar
- Where a question asks about only part of a class, take the matching part of that bar's area
- The frequency density is constant across the bar, so the frequency for part of it is that frequency density times the part-width
- This assumes the data is spread evenly through the class, which is why the answer is an estimate
Worked example
Reading frequencies off a histogram
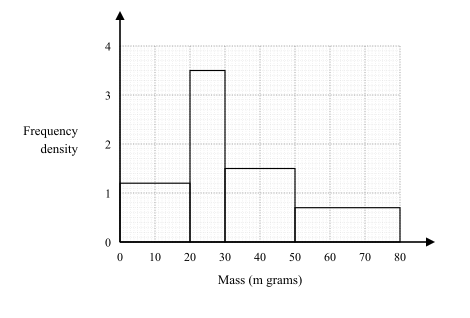
The histogram shows the masses of the 110 items from the first worked example in this note. Find the frequency for the class 20 < m ⩽ 30, and estimate how many items have a mass between 30 g and 40 g.
Solution:
- For the whole class, frequency = frequency density × class width
- The bar for 20 < m ⩽ 30 has frequency density 3.5 and width 10
- Frequency = 3.5 × 10 = 35 items, matching the original table
- For 30 g to 40 g, this is part of the class 30 < m ⩽ 50, whose frequency density is 1.5
- The part-width is 40 − 30 = 10
- Estimated frequency = 1.5 × 10 = 15 items
- This is an estimate because it assumes the 30 items in that class are spread evenly across its full width of 20
Comparing two histograms
- Two histograms can be compared by eye only when both use frequency density on the same vertical scale
- Otherwise read the frequency densities off each one, using its own scale, before comparing them