1. Recognising the standard shapes
The families you must know
- Being able to match an equation to the right picture saves plotting and catches plotting errors
- Linear, written y = mx + c, or as a vertical line x = k, is a straight line
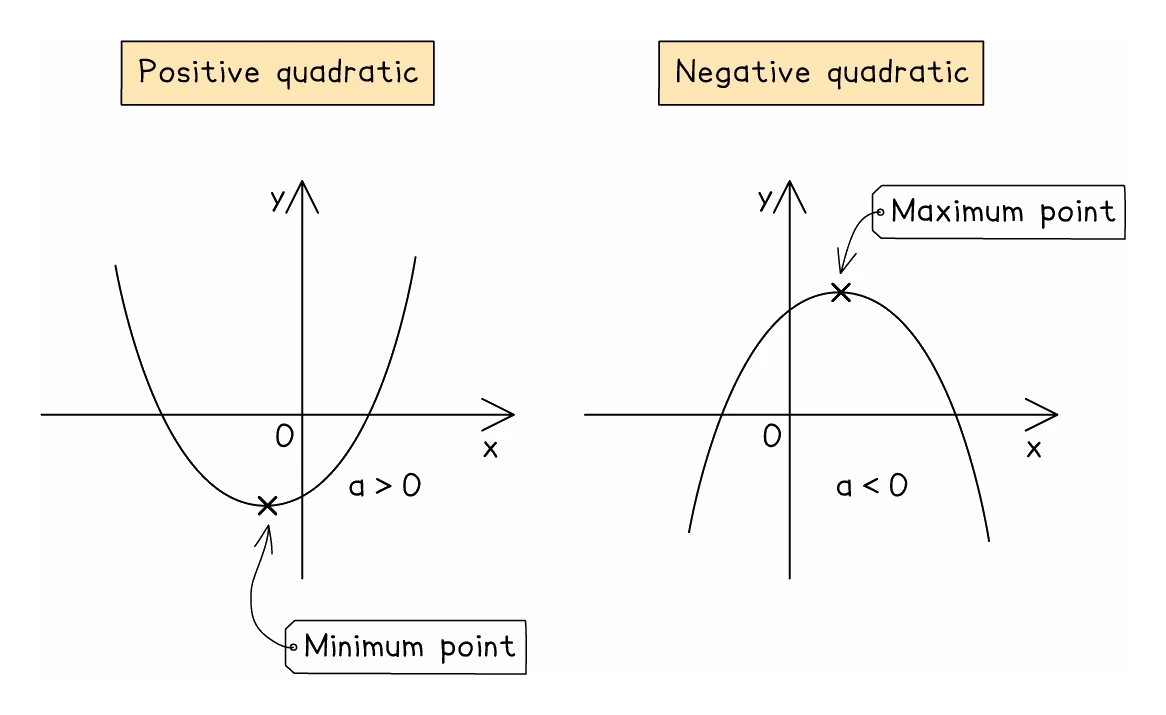
- Quadratic, written y = ax² + bx + c, is a single u-shape or n-shape, symmetrical about a vertical line through its lowest or highest point
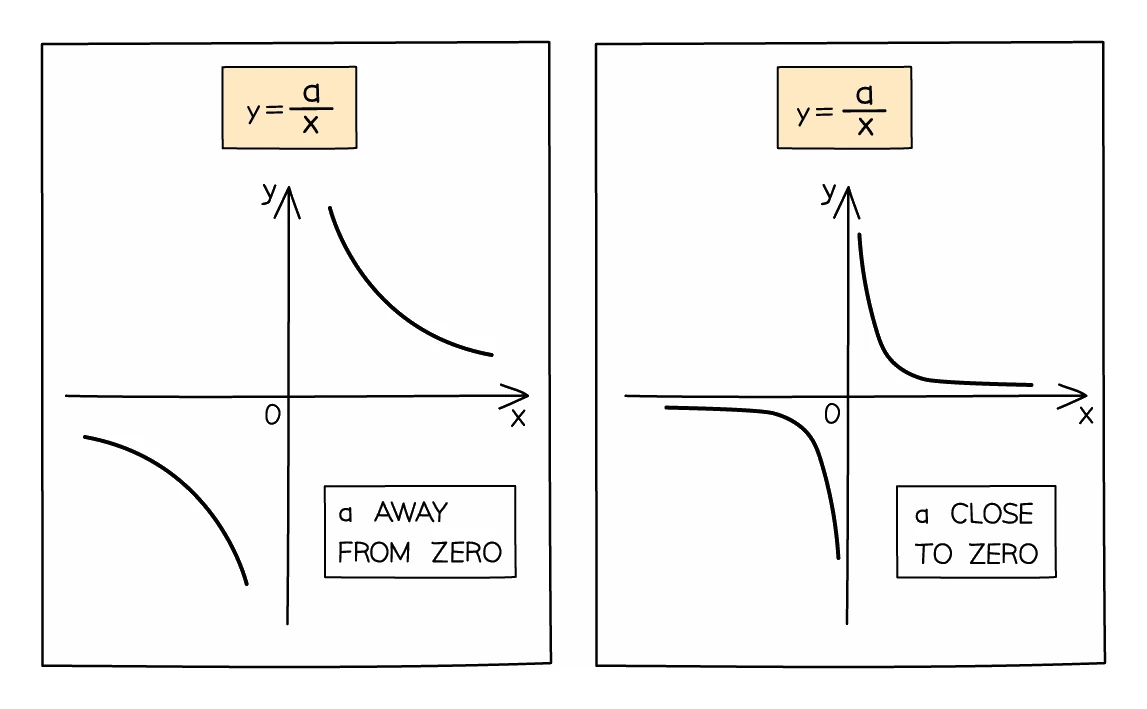
- Reciprocal, written y = a ÷ x, is two separate branches that never meet either axis
- The sign of the number in front reflects each shape vertically, so y = −x² is an n-shape where y = x² is a u-shape
Worked example
Matching an equation to its shape
Say what shape each of these graphs has: (a) y = 2x + 3 (b) y = x² − 4 (c) y = 6/x (d) y = 5 − x²
Solution:
- Read the highest power of x first, because that is what fixes the family
- (a) The highest power is 1, so it is a straight line, sloping up with gradient 2
- (b) The highest power is 2, so it is a parabola, u-shaped because the number in front of x² is positive
- (c) x is on the bottom of a fraction, so it is a reciprocal graph: two separate branches, one in each of two opposite quadrants
- (d) The highest power is again 2, so this is a parabola too, but the number in front of x² is negative, so it is n-shaped
- Comparing (b) and (d) shows that the sign in front of the squared term, not the rest of the equation, decides which way up the curve sits
2. Completing a table of values
Substituting carefully
- A table question gives the equation and a row of x values, and asks for the matching y values
- Some entries are already filled in, and those are worth checking against your own working as a test of your method
- Bracket every negative x value as you substitute, then apply the order of operations
- For y = 5 − x² at x = −3: y = 5 − (−3)² = 5 − 9 = −4
- A squared term turns a negative input positive
- On Paper 3, the calculator's table function will generate the whole row at once from the function, the start value, the end value and the step; on Paper 1 every value is worked out by hand
- A reciprocal term has no value at x = 0, so that cell stays empty rather than being filled with a zero
Exam tip
Plot every value from your own table
A table of values with its graph is set in 10 of the 22 papers. All but one of the graph's 3 or 4 marks are for points plotted correctly from your own table, so a wrong value plotted accurately still scores. Plot every pair you have, even one you doubt. Only the correct smooth curve earns the last mark.
Worked example
Filling in a row of values
Fill in the missing y values in the table for y = x² − 3x + 1.
| x | −1 | 0 | 1 | 2 | 3 | 4 |
|---|---|---|---|---|---|---|
| y | 5 | −1 |
Solution:
- At x = 0: 0 − 0 + 1 = 1
- At x = 1: 1 − 3 + 1 = −1
- At x = 3: 9 − 9 + 1 = 1
- At x = 4: 16 − 12 + 1 = 5
- Check a given entry the same way, bracketing the negative: at x = −1, (−1)² − 3 × (−1) + 1 = 1 + 3 + 1 = 5, which matches the table
- The completed row is 5, 1, −1, −1, 1, 5
- The values repeat symmetrically, so the line of symmetry lies half way between x = 1 and x = 2, at x = 1.5
Plotting and drawing
- Plot each pair as a cross, accurate to within half a small square
- Join the points with a single smooth freehand curve, never with a ruler and never as a series of straight segments
- Let the expected shape guide you: a quadratic must be symmetrical, and a reciprocal comes in two separate branches
- A point that sits off the pattern is almost always an arithmetic slip, so recheck it before drawing through it
- Read the axis scales before plotting, since the two axes rarely use the same one
3. Using a graph to solve an equation
Reading the answers off
- The solutions of an equation are the x values where two graphs meet
- Where the equation is set equal to zero, the answers are where the curve crosses the x-axis
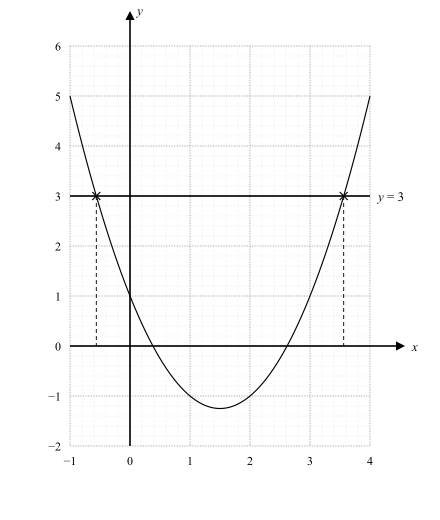
- Where it is set equal to a number, draw that horizontal line and read across
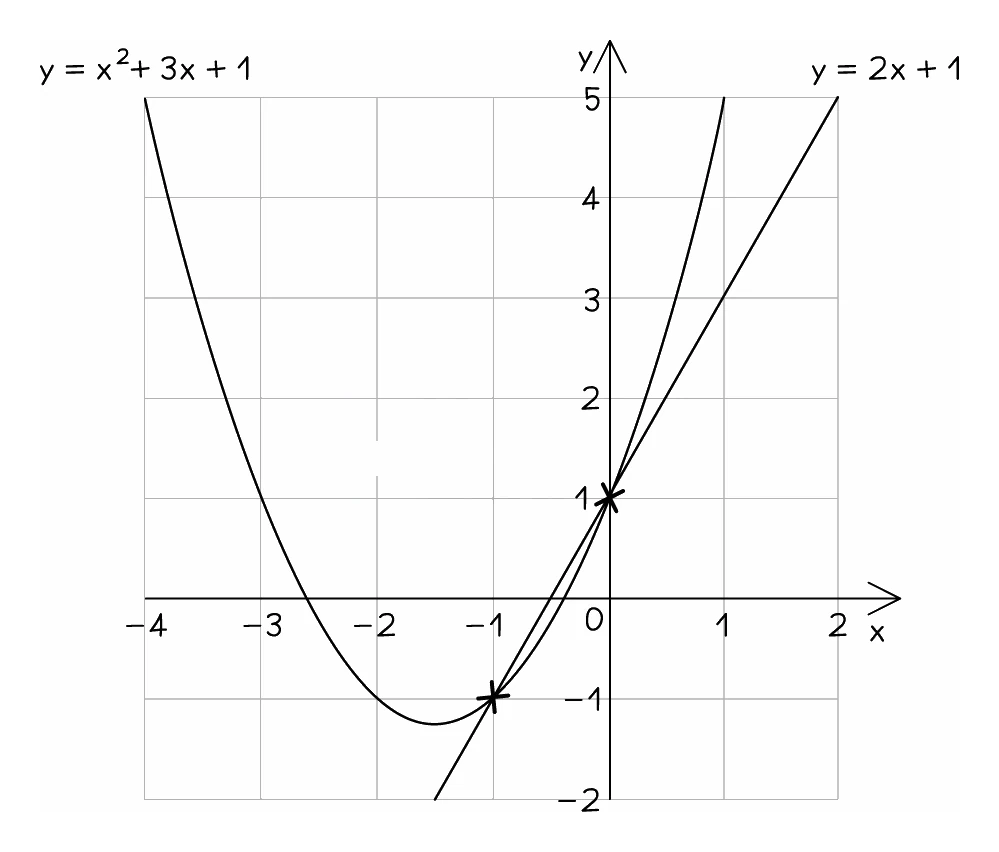
- Where two curves are given, the meeting points solve them simultaneously, and there the y values are wanted too
- Read to within half of the smallest square, the accuracy the syllabus sets, and give the x values only, unless the question asks to solve simultaneously
When the equation is not the one plotted
- A question often asks you to solve an equation that is not the one drawn
- Rearrange the new equation until one side is exactly the expression that was plotted
- Whatever is left on the other side is the line you must draw on the grid
- Then read off the x values where that line cuts the curve
Exam tip
Each crossing point is a separate mark
Each solution read off the graph is a separate mark, and it is checked against the curve you drew, so a slip earlier in the question does not cost it. Give an x value for every point where the line meets your curve, even when your curve looks wrong.
Worked example
Choosing the line to draw
The graph of y = x² − 3x + 1 is drawn on a grid. Explain how to use it to solve x² − 3x − 2 = 0.
Solution:
- The plotted expression is x² − 3x + 1, so make that appear on one side of the new equation
- Start from x² − 3x − 2 = 0
- Add 3 to both sides: x² − 3x + 1 = 3
- The left side is now exactly the plotted curve
- The line to add to the grid is therefore y = 3
- The solutions are the x values where that line meets the curve