1. Investigating rate of reaction
What rate of reaction means
- The rate of reaction is how quickly the reactants are used up, or how quickly the products are formed
- Practically, rate is measured by following one quantity that changes over time:
- Volume of gas given off, collected over water or in a gas syringe
- Mass lost from a flask sitting on a balance as a gas escapes
- Time taken for a visible change (a precipitate, a colour change, a cross becoming invisible)
- There are four factors to investigate experimentally: , , temperature, and the presence of a
Common exam question
Why the mass falls and what the cotton wool is for
Question: Give a reason why the balance reading falls during the reaction, and state what the cotton wool in the flask is for (1–2 marks).
Set in 3 of the 23 papers, each time with marble (calcium carbonate) chips and hydrochloric acid in a flask on a balance. The mass falls because the carbon dioxide escapes from the flask. Say that the gas leaves: one scheme refused "given off" or "produced" on its own, and a wrongly named gas scores nothing.
The cotton wool stops acid spray leaving the flask while letting the gas out, so the drop in mass is due to the gas alone and the result is accurate. "It stops gas escaping" is rejected, because the method depends on the gas escaping, and "it stops the solid leaving" is ignored.
Effect of surface area: marble chips with hydrochloric acid
- Place a fixed mass of marble chips (calcium carbonate) into a conical flask
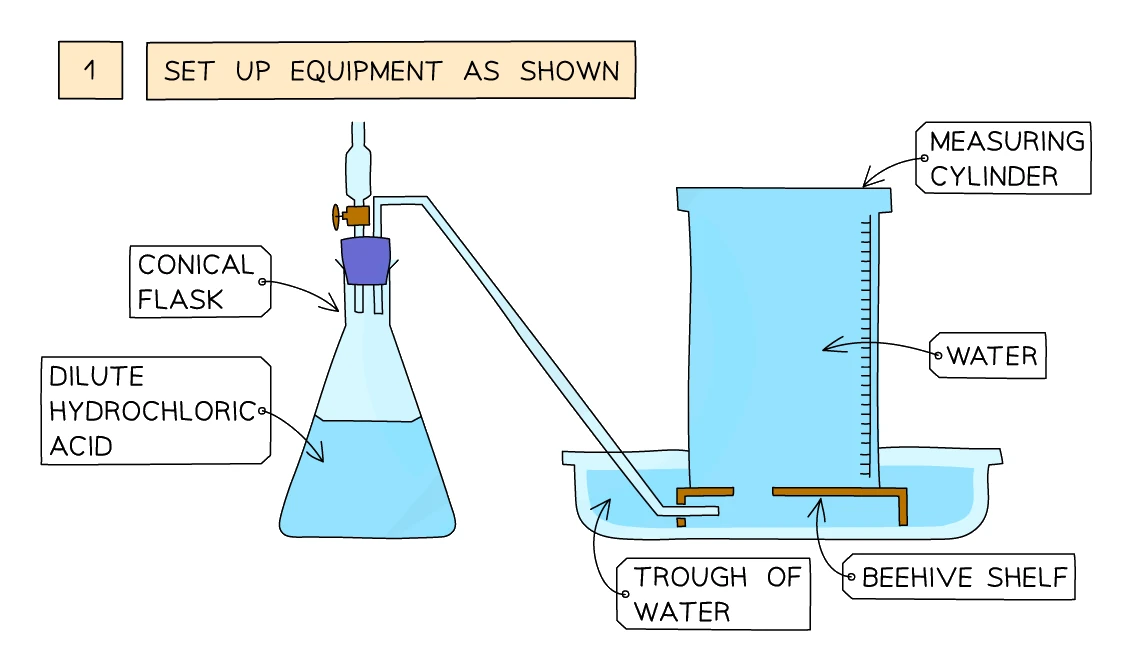
- Add a fixed volume of dilute hydrochloric acid and immediately close the flask with a bung connected by a delivery tube to an inverted measuring cylinder over a water trough
- Time how long it takes to collect a fixed volume of CO2, or read the volume collected after a fixed time
- Repeat with chips of a different size (small chips, medium chips, powdered) while keeping mass and acid concentration the same
- The smaller the chip, the larger the surface area exposed, so the reaction goes faster
Effect of concentration: the disappearing-cross experiment
- Sodium thiosulfate solution reacts with dilute hydrochloric acid to produce a fine yellow sulfur precipitate that gradually clouds the mixture:
Na2S2O3(aq) + 2 HCl(aq) → 2 NaCl(aq) + S(s) + SO2(g) + H2O(l)
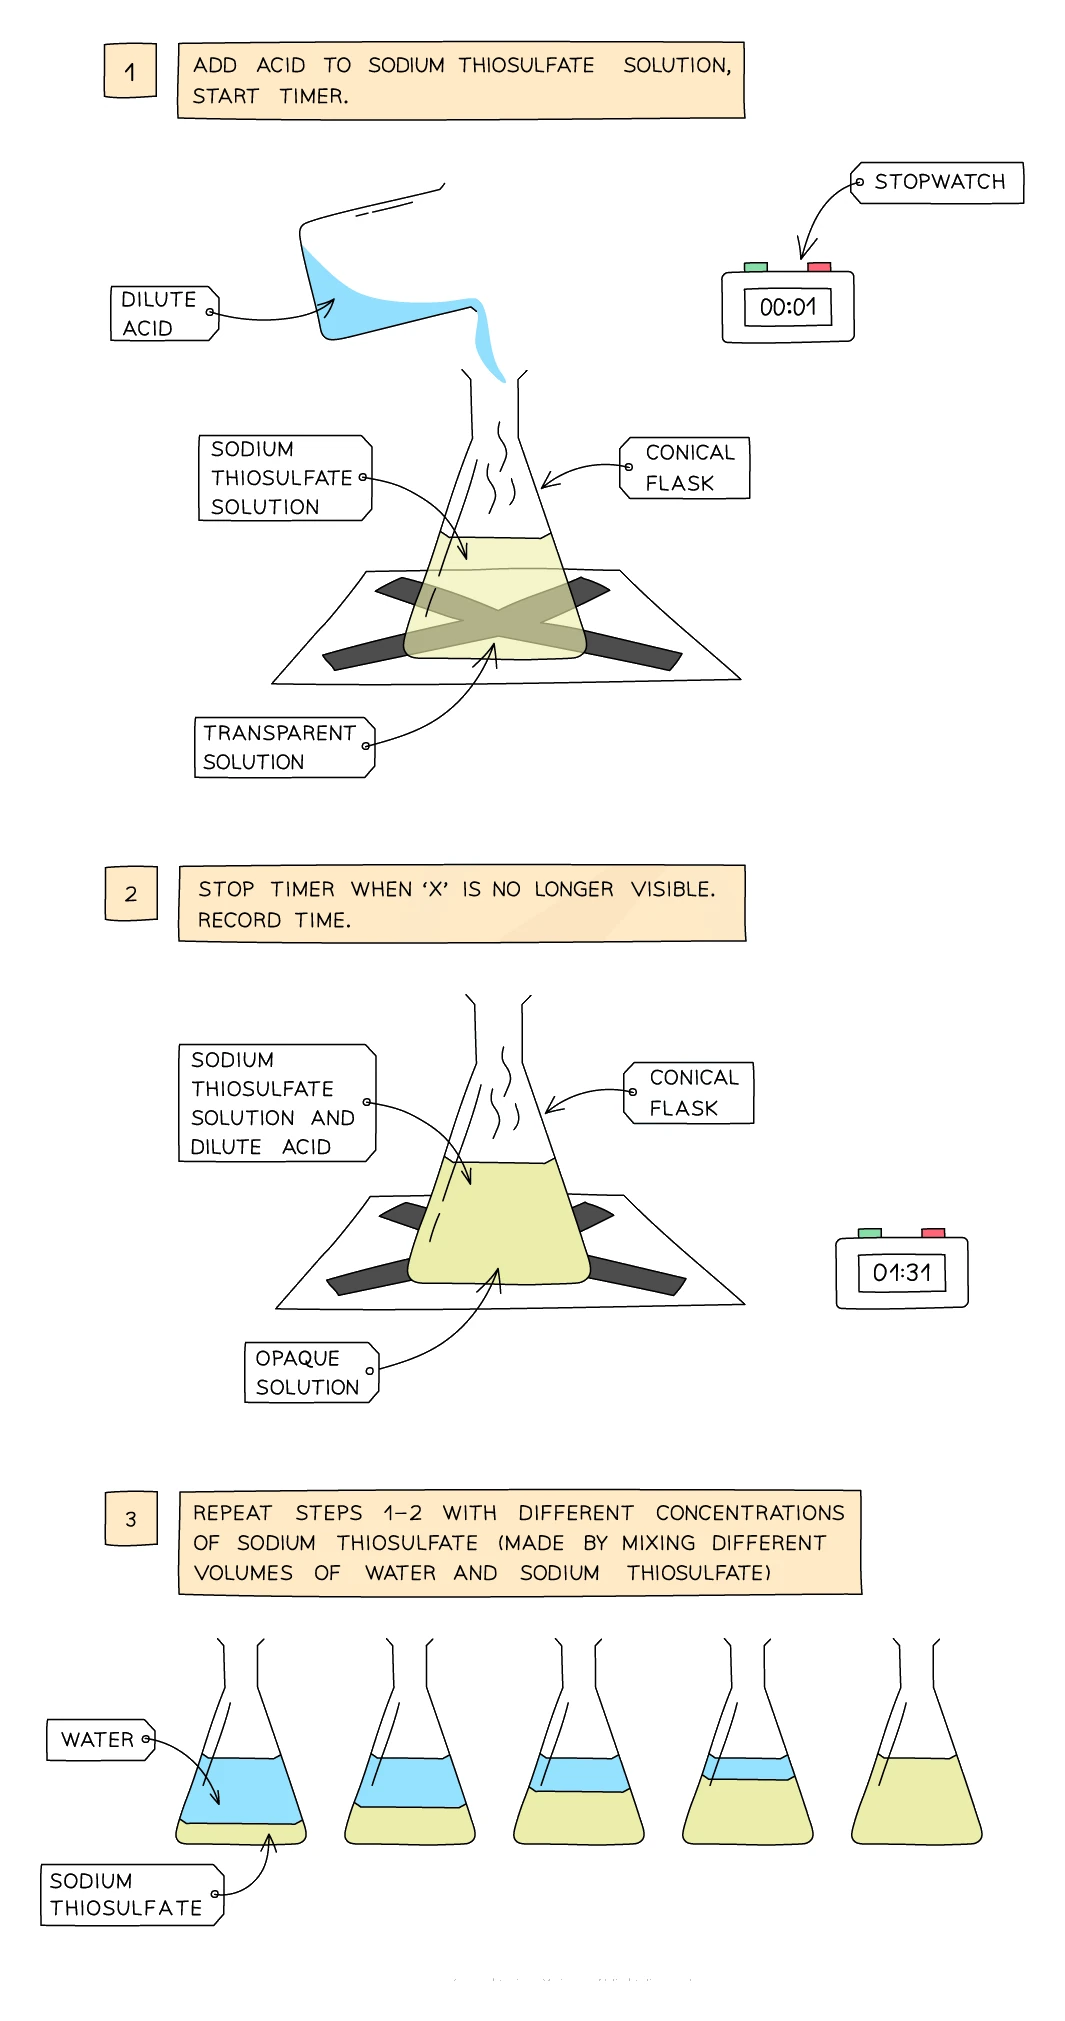
- Measure 40 cm3 of sodium thiosulfate solution into a conical flask placed on a piece of paper with a black cross drawn on it
- Look down through the flask at the cross from directly above
- Add 10 cm3 of dilute hydrochloric acid, start a stopwatch, and stop it when the cross is no longer visible through the cloudy mixture
- Repeat with sodium thiosulfate diluted with different volumes of water (keep total volume the same) to vary concentration
Effect of temperature: magnesium in dilute acid
- Place a measured volume of dilute hydrochloric acid into a conical flask sitting in a water bath set to a fixed temperature
- When the acid has reached temperature, drop in a 3 cm strip of clean magnesium ribbon and immediately begin timing
- Stop the clock when the last of the magnesium has dissolved (no more bubbling)
- Repeat at higher and lower temperatures (e.g. 20, 30, 40, 50 °C) while keeping all other variables constant
- The hotter the acid, the faster the magnesium dissolves
Effect of a catalyst: hydrogen peroxide decomposition
- Hydrogen peroxide solution slowly decomposes on its own:
2 H2O2(aq) → 2 H2O(l) + O2(g)
- Add a fixed volume of H2O2(aq) to a conical flask connected via a delivery tube to an inverted measuring cylinder over water
- Sprinkle in a measured mass of solid catalyst (manganese(IV) oxide, MnO2) and immediately replace the bung
- Read the volume of oxygen gas collected after, say, 30 s
- Repeat without the catalyst as a control; the difference shows the catalyst's effect
Why surface area depends on particle size
- A solid only reacts at its outer surface — the atoms or ions buried inside the lump cannot meet the other reactant until the outer layers have been used up
- Breaking a single lump into smaller pieces exposes the interior atoms; the total mass stays the same but the exposed to the other reactant rises sharply
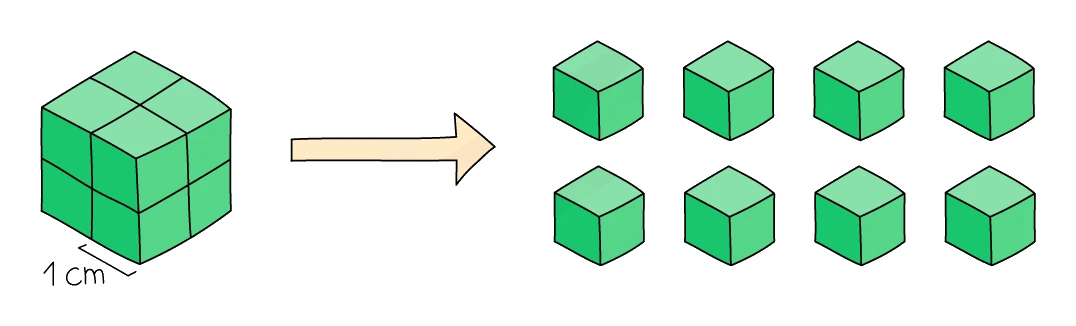
- A useful way to picture it: a 1 cm cube has six 1 cm × 1 cm faces (6 cm2 total). Slicing it into eight 0.5 cm cubes gives 8 × 6 × (0.5 × 0.5) = 12 cm2 of surface — the surface area has doubled even though the mass has not changed
- Powders therefore react much faster than chips of the same mass, and chips react much faster than a single lump
- This is why fine flour dust can cause explosions in mills: the surface area per gram is so large that the whole load can ignite almost instantly once a spark arrives
2. Explaining rate of reaction with collision theory
The collision theory model
- For two reactant particles to react, they must:
- Collide with each other
- Collide with at least the minimum kinetic energy needed to break the existing bonds, called the (Ea)
- Collide with the correct orientation so that bonds can rearrange
- A collision that meets all three conditions is a
- The rate of reaction is set by the number of successful collisions per second
- Anything that increases either the frequency of collisions or the proportion of collisions that have enough energy will speed the reaction up
How concentration changes the rate
- A higher concentration packs more reactant particles into the same volume
- More particles in a fixed volume means more collisions per second between the right kinds of particle
- More collisions → more successful collisions per second → faster reaction
- Doubling concentration roughly doubles the collision rate
Common exam question
Explaining the effect of concentration on the rate
Question: Explain, in terms of particle collision theory, how decreasing or increasing the concentration affects the rate of a reaction (2–3 marks).
Set in 3 of the 23 papers. The marks form a chain of two or three points: a lower concentration means fewer particles in the same volume, so there are fewer collisions per unit time, so the rate decreases. Where a third mark exists it is for that last step, so end with the rate.
Keep energy out of it. All three schemes reject any mention of the particles having more or less energy, or moving faster or slower: one scored the whole answer zero for it and another capped it at one mark. "Less chance of a collision" is ignored, because the credited idea is collision frequency. If a graph of initial rate against concentration is given instead, the two marks are for saying the rate rises with concentration and that the two are directly proportional.
How pressure changes the rate (for gases)
- Increasing the pressure of a gas means compressing the same number of particles into a smaller volume
- The result is the same as increasing concentration in solution — more particles per unit volume, more collisions per second, faster reaction
How temperature changes the rate
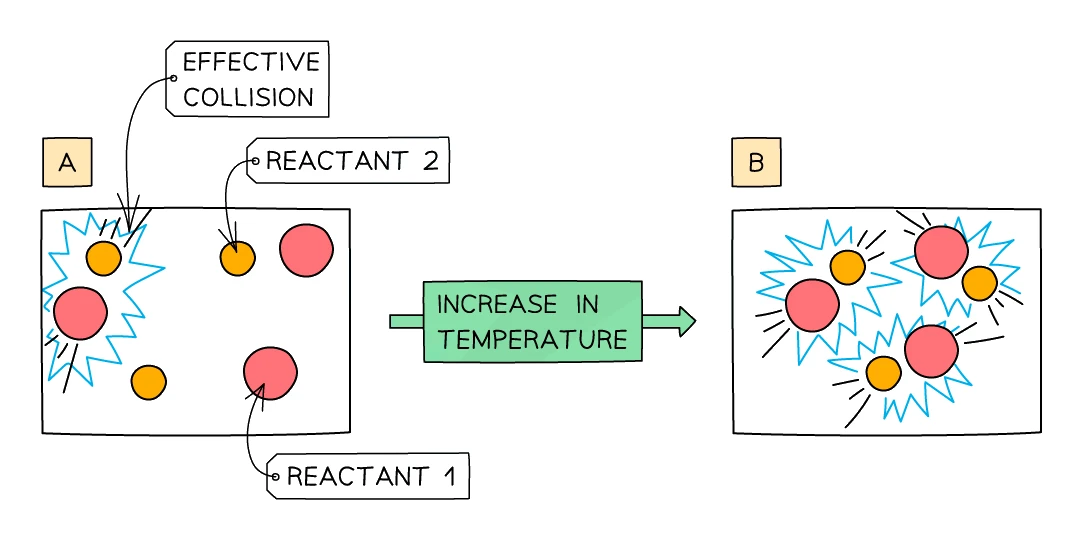
- Increasing the temperature has two effects, both of which speed the reaction up:
- Particles move faster and so collide more often
- More importantly, a larger fraction of particles now have kinetic energy at or above the activation energy, so a much larger proportion of collisions are successful
- The energy effect dominates: as a quick guide, the rate of many common reactions doubles for every 10 °C rise in temperature
Common exam question
Explaining the effect of temperature on the rate
Question: Explain, using collision theory, the effect of increasing the temperature on the rate of a reaction (3–4 marks).
Set in 6 of the 23 papers, once in reverse (why a lower temperature gives a shallower curve). The marks: the particles gain kinetic energy and move faster; so more of them have energy at or above the activation energy; so there are more successful collisions per unit time; so the rate increases. The plain statement that the rate increases is a mark in most of these schemes, so say it. "More frequent successful collisions" covers the frequency point and the success point in one phrase.
Two slips cost marks. Giving only "more collisions", with no energy point, leaves the energy mark unearned. Saying that heating lowers the activation energy loses a mark: the activation energy is fixed, and it is the share of particles that can reach it that grows. "The particles vibrate more" is ignored.
How surface area changes the rate
- For a solid reacting with a liquid or gas, the reaction can only happen at the surface of the solid where the two phases meet
- Cutting the solid into smaller pieces exposes more of the underlying particles
- More exposed area = more collisions per second between the solid surface and the surrounding particles = faster reaction
- Same idea as crushing a sugar cube into powder — it dissolves much faster
Common exam question
Explaining why smaller pieces react faster
Question: Explain, using particle collision theory, how using smaller pieces or a powder of the solid affects the rate, or give the reason for using a powder (1–3 marks).
Asked in 3 of the 23 papers, once as a one-mark reason for choosing a powder (to make the reaction faster). For the full explanation the marks are: the smaller pieces have a larger surface area (a higher surface area to volume ratio is accepted); so more collisions per unit time happen between the solution's particles and the solid; so the rate increases. Give all three, including the conclusion.
This is a surface-area answer, not an energy one: the three-mark scheme capped the answer at one mark if the particles were said to have more energy or to move faster. In the two-mark version, which asked for the advantage of a powder, the surface area and the faster reaction were the two marks and collision theory was not needed.
3. Catalysts
What a catalyst is
- A catalyst is a substance that speeds up a chemical reaction without being used up in it
- The mass of the catalyst is the same at the end of the reaction as at the start
- Only small amounts of catalyst are usually needed because each particle of catalyst can take part in many reactant turnovers
- A catalyst is neither a reactant nor a product, so its formula is written next to the arrow itself rather than inside the balanced equation
Industrial examples of catalysts
| Process | Catalyst | What it does |
|---|---|---|
| Haber process: N2 + 3 H2 ⇌ 2 NH3 | Iron | Speeds up the synthesis of ammonia |
| Contact process: 2 SO2 + O2 ⇌ 2 SO3 | Vanadium(V) oxide, V2O5 | Step in the manufacture of sulfuric acid |
| Catalytic decomposition of H2O2 | Manganese(IV) oxide, MnO2 | School demonstration of catalysis |
| Catalytic cracking of long-chain alkanes | Zeolites (aluminosilicates) | Breaks heavy fractions of crude oil into petrol-range products |
| Hardening of vegetable oils | Nickel | Adds hydrogen across C=C bonds to make margarine |
- Many catalysts are transition metals or their oxides — their variable oxidation states allow them to accept and donate electrons easily, which is what makes them catalytic
- Enzymes are biological catalysts: protein molecules that accelerate specific reactions inside cells
How a catalyst works
- A catalyst provides an alternative reaction pathway that has a lower than the uncatalysed route
- More reactant particles now have at least the (lower) activation energy at any given temperature, so a larger proportion of every collision is successful
- The catalyst is not consumed because it is regenerated at the end of the alternative pathway
Common exam question
How a catalyst increases the rate of a reaction
Question: Describe or explain how a catalyst increases the rate of a reaction (2 marks).
Set in 7 of the 23 papers, at least twice a year and four times in a hydrogen peroxide question. The two marks are for an alternative route (pathway) for the reaction and for that route having a lower activation energy. One scheme also accepted "so more collisions have enough energy to react" for the second point, but the phrase to learn is lower activation energy.
Nothing else scores. "It speeds up the reaction" and "it is not used up" restate the question and are ignored, and one scheme gave zero to any answer saying the catalyst gives the particles more energy or makes them move faster. The one-mark version, asking the reason for using a catalyst in an industrial process, wants only that it increases the rate: "to increase the yield" is rejected there, and the pathway explanation is ignored there, so on its own it earns nothing.
4. Activation energy and reaction profiles
What activation energy is
- Activation energy, Ea, is the minimum energy that colliding reactant particles must have in order to react
- Below Ea, even a head-on collision just bounces apart; above Ea, the existing bonds can start to break and new bonds form
- Different reactions have different activation energies: rusting has a small Ea (rust forms slowly at room temperature) while burning natural gas has a large Ea (needs a spark or flame to start)
Reaction profiles
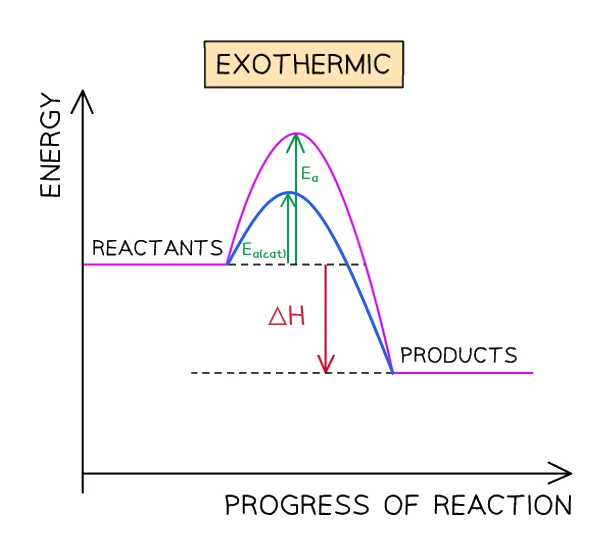
- A plots the energy of the reactants, the products, and the in between as the reaction progresses
- The horizontal axis is "progress of reaction"; the vertical axis is "energy"
- Two key features:
- The vertical distance from the reactants line up to the peak of the profile is the Ea
- The vertical distance from the reactants line to the products line is the overall enthalpy change ΔH
- For an exothermic reaction, products sit lower than reactants and ΔH is negative
- For an endothermic reaction, products sit higher than reactants and ΔH is positive
- In both cases the activation-energy hump rises above the starting energy of the reactants
Catalysts on the reaction profile
- A catalyst lowers the activation-energy hump without changing the energies of the reactants or the products
- On the reaction profile, the curve has a lower peak but the same starting and ending levels
- The overall ΔH is unchanged — a catalyst does not change how exothermic or endothermic a reaction is, only how fast it gets there
Common exam question
Labelling a reaction profile
Question: Label or complete a reaction profile to show the activation energy and the enthalpy change, or draw the curve for the same reaction with a catalyst (1–4 marks).
Set in 3 of the 23 papers, all on Paper 2. Both labels are vertical distances measured from the energy level of the reactants: the activation energy runs from the reactants up to the top of the hump, and ΔH from the reactants to the level of the products. A double-headed arrow is always accepted; a single arrowhead must point away from the reactants, and an arrow drawn the other way is rejected.
When you draw the whole profile, the levels earn marks before the arrows do: label both horizontal lines, and put the products below the reactants for an exothermic reaction and above them for an endothermic one. A catalysed curve starts and ends at the same two levels as the original but has a lower peak.
5. Required practicals
Practical: effect of surface area on the rate of reaction
- Aim: show that powdered marble reacts faster with hydrochloric acid than the same mass of large lumps
- Apparatus: conical flask, delivery tube with bung, water trough, 100 cm3 inverted measuring cylinder, stopwatch, balance, 1.0 mol dm−3 hydrochloric acid, three samples of calcium carbonate (large chips, small chips, powder), each weighed to the same fixed mass (e.g. 4.0 g)
- Method:
- Set up the gas-collection apparatus over the water trough with the inverted measuring cylinder filled with water
- Pour 50 cm3 of HCl into the conical flask
- Tip in the 4.0 g of large chips, immediately push in the bung, and start the stopwatch
- Read off the gas volume in the measuring cylinder every 15 seconds for 2 minutes
- Empty and dry the apparatus; repeat with 4.0 g of small chips and again with 4.0 g of powdered calcium carbonate
- Sample results (volume of CO2 collected, cm3):
| Time / s | Large chips | Small chips | Powder |
|---|---|---|---|
| 15 | 4 | 12 | 28 |
| 30 | 7 | 22 | 47 |
| 60 | 13 | 38 | 70 |
| 90 | 19 | 50 | 78 |
| 120 | 24 | 58 | 80 |
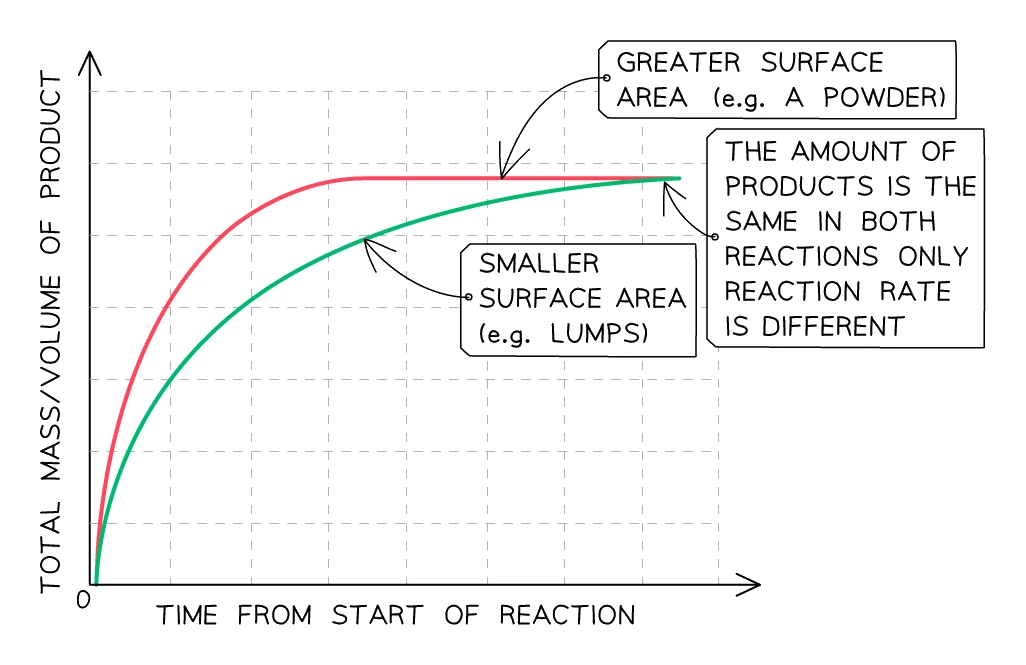
- Plot volume of CO2 (y) against time (x) for all three runs on the same axes
- The powder curve is the steepest at the start and levels off first, but every curve plateaus at the same final volume because the same total mass of CaCO3 was used in each run
Common exam question
Plotting the results and drawing the curve of best fit
Question: Plot the results, draw a curve of best fit, circle the anomalous result and give a reason for it, or read a value from the curve showing your working (1–2 marks per part).
Set in 5 of the 23 papers. Plot to the nearest grid line (tolerance half a small square). The best-fit curve for a gas-volume graph must start at the origin and level off at the final volume; draw it smoothly and leave the anomalous point out. An anomaly in a timed run is usually a timing slip, such as taking the reading too soon, starting the timer late or stopping it early, though a run at a higher temperature than the others is also credited, and the more likely value for it is read from your curve.
Reading a value is two marks: one for the line drawn on the graph from the axis to the curve, one for the reading, accepted within a small range. Draw the line even when you can read the value by eye.
Common exam question
Explaining the shape of a rate graph
Question: Explain why the rate is greatest at the start, explain the shape of the graph, or give the reason the reaction stops while solid remains (1–6 marks).
Set in 6 of the 23 papers. Each region earns a linked pair. The curve is steepest at the start because the concentration of the acid is highest, so collisions are most frequent; it gets less steep as the acid is used up and collisions become rarer; it levels off because the acid has all been used up. Solid left in the flask means the acid ran out; no solid left means the acid was in excess.
Describing the curve is not explaining it (one scheme ignored graph references), and two schemes reject any claim that the particles have more energy, one for both marks. "The acid is a limiting factor" is ignored and "the acid is saturated" is wrong. The reaction has stopped when the mass is constant, fizzing ends or the syringe stops.
Practical: effect of a catalyst on the rate of reaction
- Aim: compare the rate of hydrogen peroxide decomposition with several different solids to see which one is the best catalyst
- Apparatus: as above (gas collection over water), plus 20-vol H2O2 solution and a set of solid candidate catalysts measured out to the same mass (e.g. 0.5 g): manganese(IV) oxide, lead(II) oxide, iron(III) oxide, copper(II) oxide
- Method:
- Add 25 cm3 of H2O2(aq) to the conical flask
- Sprinkle in 0.5 g of the first solid, close the bung, start the stopwatch
- Read off the volume of O2 collected every 15 seconds for 90 seconds
- Repeat with each of the other solids in turn (fresh H2O2 solution each time)
- Plot volume of O2 (y) against time (x) on a single set of axes — the steepest curve identifies the most effective catalyst
- Manganese(IV) oxide gives by far the steepest line and is the standard school catalyst for this decomposition
Common exam question
Sketching the curve for a changed condition
Question: On the same grid, draw the curve expected when the experiment is repeated at a higher temperature, with a powder, or at half the concentration (2 marks).
Set in 5 of the 23 papers. One mark is for the gradient: the new curve starts at the origin, steeper when the reaction is faster (higher temperature, powder, catalyst) and shallower for a lower concentration. The other mark is for where it levels off. If only the rate has changed, the plateau stays at the original final volume. If the amount of the reactant that runs out has changed, the plateau moves: half the acid concentration, with the solid in excess, gives half the gas and a plateau at half the height (tolerance half a small square).
Asked to explain such a curve instead, give the same two ideas: half the moles of acid gives half the volume of gas, and the lower concentration makes the curve less steep.
Worked example
Calculate the rate of reaction from a volume–time graph
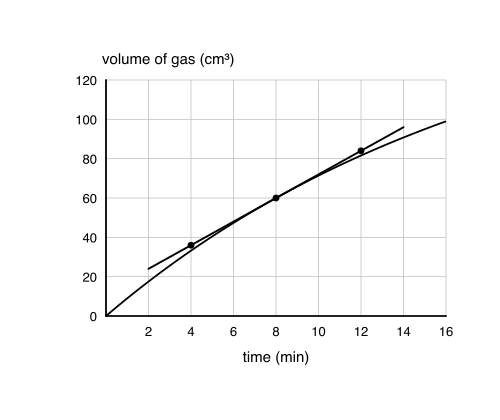
The graph plots how much gas a reaction had given off against time: 42 cm³ after 6 minutes. The curve is steepest at the start, gets less steep as the reaction slows, and levels off once the reaction has finished. Find the rate of reaction at 6 minutes, in cm³/min.
Solution:
- Draw a tangent to the curve at the point where time = 6 minutes. The tangent must touch the curve at exactly that point and extend in a straight line on both sides.
- Read off two well-separated points on the tangent line, for example (2 min, 26 cm³) and (10 min, 58 cm³).
- Calculate the gradient: change in volume ÷ change in time = (58 − 26) ÷ (10 − 2) = 32 ÷ 8 = 4 cm³/min
Set in 4 of the 23 papers, this question spreads its marks across the method. The tangent drawn on the graph, touching the curve only at the stated time, is a mark on its own, and when the paper has drawn the tangent for you the gradient triangle must be drawn on it to earn that first mark. The gradient calculation is the next mark, the answer is accepted within a range that allows for slightly different tangents, and the unit is a separate mark whenever the question asks for it. Dividing the total volume by the total time (42 ÷ 6 = 7 cm³/min) gives the average rate over the whole period, not the rate at 6 minutes: the mark schemes give that one mark at most for the number.
Common exam question
Describing a method to compare catalysts
Question: Describe how a student could find which of several solids is the most effective catalyst for decomposing hydrogen peroxide (5 marks).
Set in 2 of the 23 papers, once on Paper 1 and once on Paper 2. The credited steps: put the hydrogen peroxide in the flask and add one catalyst; start the timer and record how much gas collects in a fixed time (or the time to collect a fixed volume); repeat with each solid using the same mass of catalyst, the same volume and concentration of hydrogen peroxide and the same temperature; conclude that the best catalyst gives the most gas per unit time, or the shortest time. Plotting the curves and comparing gradients also scores.
The same fair-test points answer the two-mark question that asks for two variables to keep constant: name the volume and concentration of each solution and the mass or size of the solid. One scheme refused "the same amount of acid", so say volume or concentration.