Statistical Diagrams
Statistics
Drawing one
- A pie chart divides a circle into sectors, one for each category, showing the proportions rather than the actual frequencies
- Each sector angle is that category's share of the whole turn
- Angle = (frequency ÷ total frequency) × 360°
- Work out every angle, then check they add to 360° before drawing anything
- Draw with a protractor from a radius already drawn, measuring each angle from the previous boundary
- Label every sector or provide a key
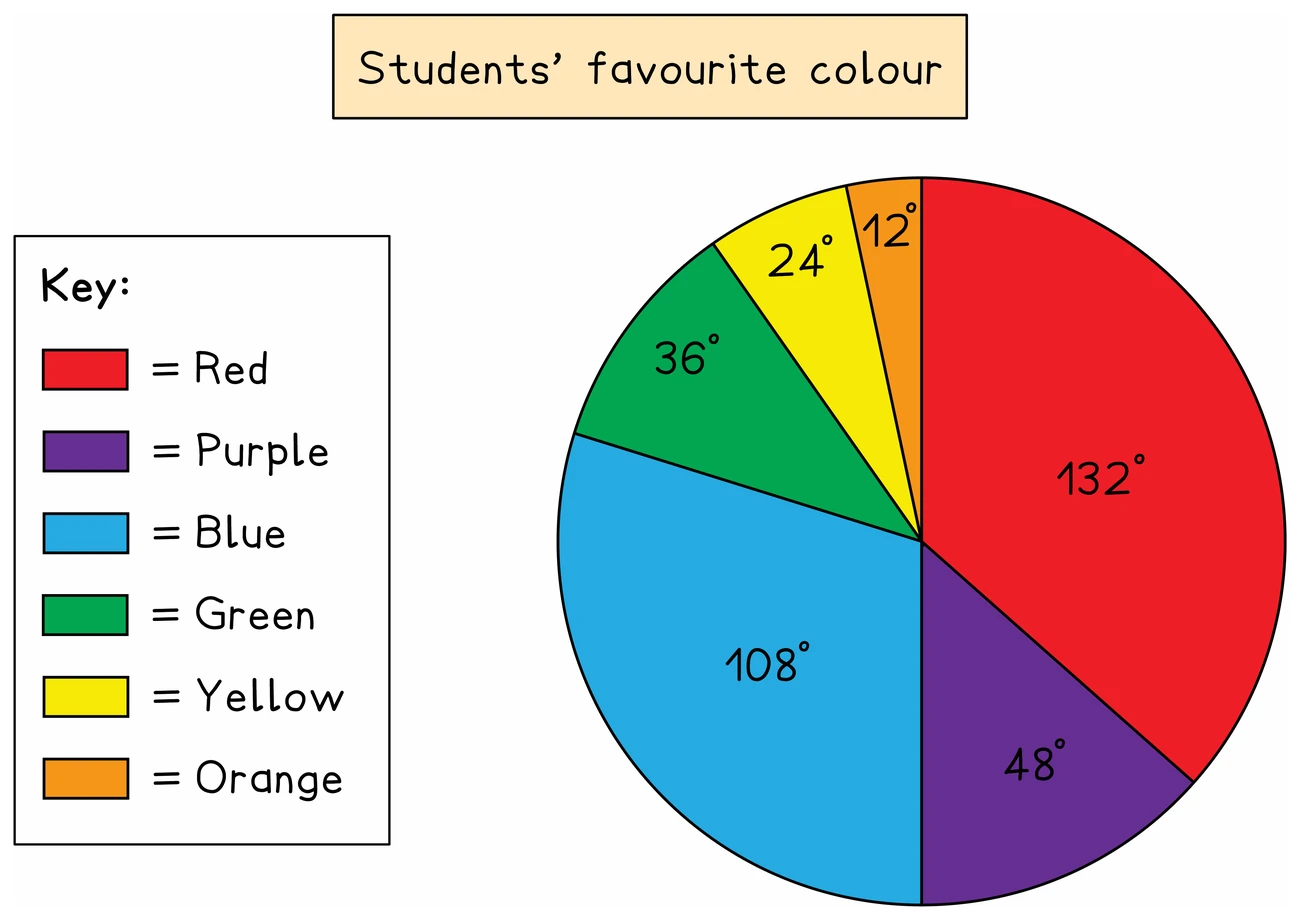
Reading one
- Going the other way, frequency = (angle ÷ 360°) × total frequency
- A sector's angle alone cannot give a frequency without the total, which is why, when two pie charts show different totals, a larger sector does not have to mean a larger frequency
Exam tip
Write the angles before you draw
Completing a pie chart earns marks for the angles you work out and separate marks for the sectors you draw. The sectors are checked against your angles, so a wrong angle drawn accurately can still earn a drawing mark. That needs your angles on the page: write each one in the table or beside the chart before you draw any sector.
Worked example
Calculating pie chart angles
Forty people are asked their favourite drink. The table shows the results. Work out the angle of each sector for a pie chart.
| Favourite drink | Tea | Coffee | Juice | Water |
|---|---|---|---|---|
| Number of people | 14 | 12 | 9 | 5 |
Solution:
- Each angle is the category's share of 360°
- With 40 people, one person's share is 360 ÷ 40 = 9°, which is the same as working out frequency ÷ 40 × 360 for each drink but needs no calculator
- Tea: 14 × 9 = 126°
- Coffee: 12 × 9 = 108°
- Juice: 9 × 9 = 81°
- Water: 5 × 9 = 45°
- Check: 126 + 108 + 81 + 45 = 360
Worked example
Finding a frequency from a pie chart
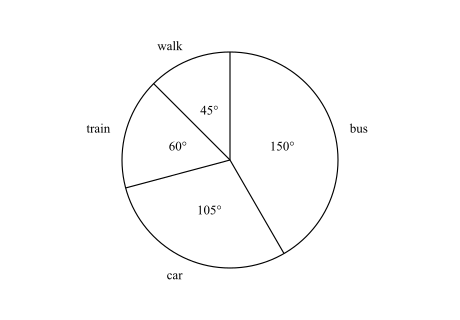
The pie chart shows how the members of a walking club travel to a meeting. Its sector angles are bus 150°, car 105°, train 60° and walk 45°. 18 more members travel by bus than by train. (a) How many members walk? (b) How many members are in the club? (c) How many members travel by car?
Solution:
- Each sector's number of members is in proportion to its angle, so first find what a known number of degrees is worth
- The total is not given, but a difference is: bus − train = 150° − 60° = 90°, and that is 18 members
- (a) The walk sector, 45°, is half of 90°, so 9 members walk
- (b) The whole circle, 360°, is 4 × 90°, so the club has 4 × 18 = 72 members
- (c) Now the total is known: frequency = (angle ÷ 360°) × total frequency, so car = 105 ÷ 360 × 72
- With no calculator, each member's share is 360 ÷ 72 = 5°, so car = 105 ÷ 5 = 21 members
- Check: bus = 150 ÷ 5 = 30 and train = 60 ÷ 5 = 12, which differ by 18, and 30 + 21 + 12 + 9 = 72