Scatter Graphs and Correlation
Statistics
Drawing one
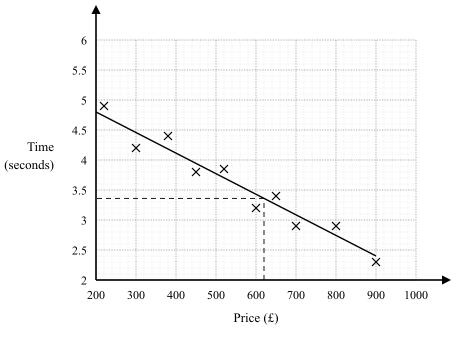
- Once a diagram has been seen to slope one way or the other, its trend can be summarised by a line of best fit
- The syllabus is precise about what it must look like
- A single ruled straight line, drawn by inspection with a ruler
- It must extend across the full data set, not just the middle
- It need not pass through any of the points, but the points should be roughly evenly distributed on either side along its whole length
- Where one point clearly sits away from the pattern, an outlier, ignore it when placing the line
- Never draw a curve, and never join the points
Using one
- The line lets you estimate one quantity from the other: go from the known value straight to the line, then turn and read the other axis (up then across from the horizontal axis, across then down from the vertical axis)
- Estimating within the range of the data is interpolation, and it is reasonably reliable
- Estimating beyond the data is extrapolation, and it is unreliable because the trend may not continue
- If a question asks whether an estimate is reliable, check whether the value lies inside the plotted range: outside it, the estimate is unreliable
Exam tip
Read the estimate from your own line
Drawing the line of best fit and using it earn separate marks. The line must be ruled, and the estimate is checked against your line if it is straight and slopes the same way as the crosses, so a line slightly out of place still keeps the estimate mark. Rule one line across all the data, then go from the given value to your line and turn to the other axis: never read the estimate from the nearest cross.
Worked example
Reading an estimate from a line of best fit
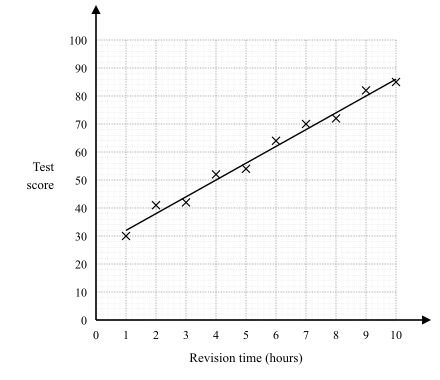
A scatter diagram plots revision time in hours against test score for students who revised for between 1 and 10 hours, and a line of best fit has been ruled on it. Use the line to estimate the score for a student who revises for 5 hours, and interpret the gradient of the line.
Solution:
- Go straight up from 5 on the hours axis to the line, then straight across to the score axis
- Each small square on the score axis stands for 2, and the line at 5 hours is 3 small squares above 50
- Estimated score = 50 + 3 × 2 = 56
- Five hours lies inside the plotted range, so this is interpolation and reasonably reliable
- For the gradient, find two places where the line crosses grid lines exactly: at 2 hours it is at 38, and at 8 hours it is at 74
- Across those 6 hours the line rises 74 − 38 = 36, so the gradient is 36 ÷ 6 = 6
- The gradient means that each extra hour of revision is associated with about 6 more marks