Price Elasticity of Supply (PES)
Allocation of Resources · 3 question types
Just like PED, supply can be sorted into five categories. All five are named in the syllabus and can be tested, so learn the value of PES for each.
| Category | Value of PES | What it means | Typical example |
|---|---|---|---|
| Perfectly inelastic | 0 | Qs is fixed; no responsiveness at all | A single Picasso painting; seats at a sold-out concert venue |
| Relatively inelastic | 0 < PES < 1 | %ΔQs is smaller than %ΔP | Most agricultural goods, oil in the short run |
| Unitary (unit) elastic | PES = 1 | %ΔQs equals %ΔP | Any supply curve drawn passing through the origin |
| Relatively elastic | PES > 1 | %ΔQs is larger than %ΔP | Manufactured goods with spare factory capacity |
| Perfectly elastic | ∞ | Producers will supply any amount at the given price; supply is unlimited | A buffer stock released at a fixed guaranteed price; a mass-produced good with plenty of idle capacity |
The quickest check on any PES value: less than 1 = inelastic; greater than 1 = elastic. But know the three exact values too: 0 = perfectly inelastic, 1 = unit elastic, infinity = perfectly elastic.
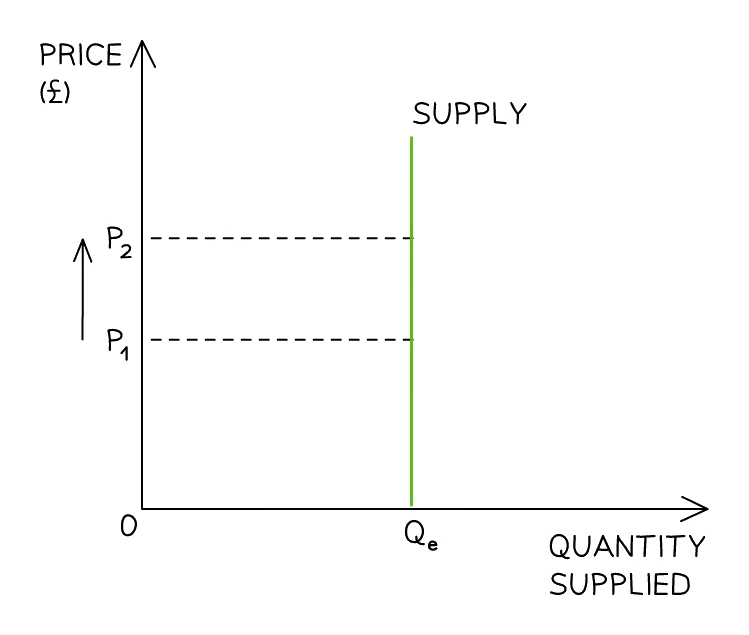
Each category corresponds to a distinctive supply-curve shape. A perfectly inelastic supply curve is vertical: quantity supplied stays fixed at Qe however far price rises, from P1 to P2.
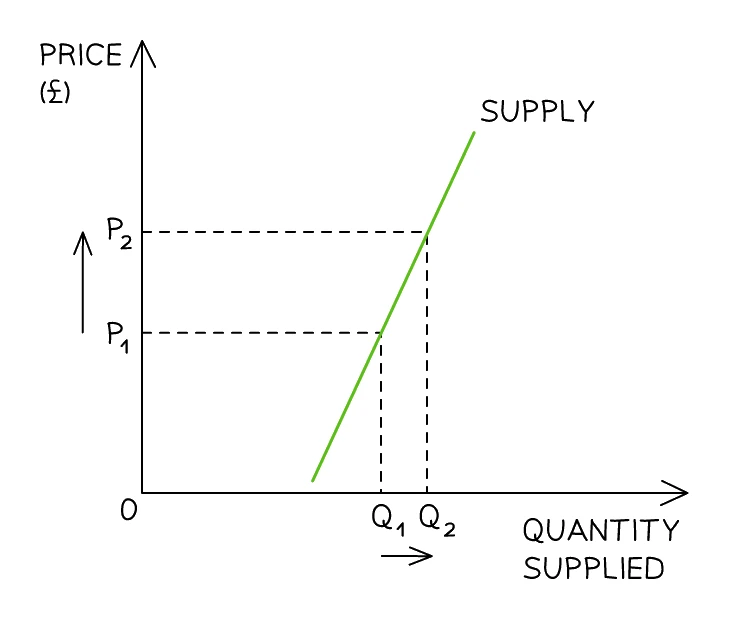
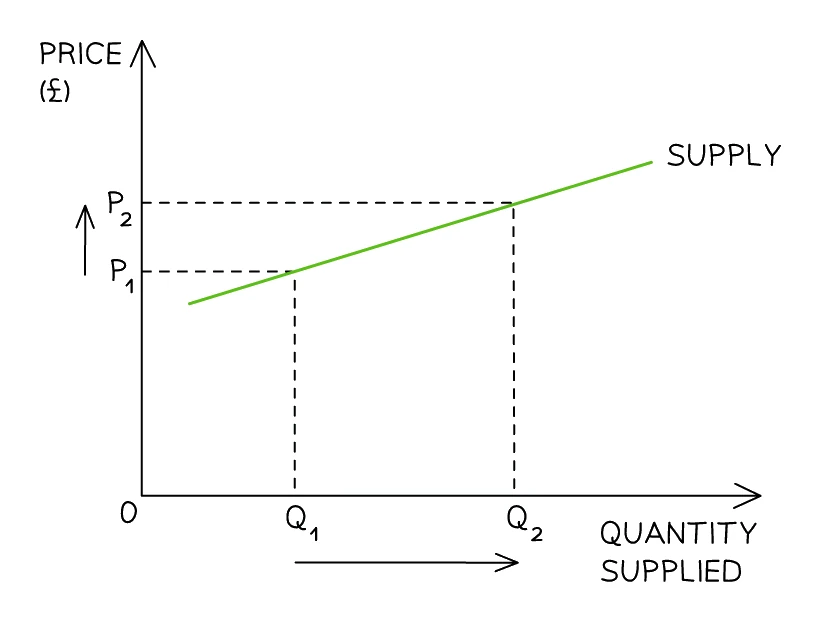
A relatively inelastic supply curve is steep: a rise in price from P1 to P2 produces a smaller proportional rise in quantity supplied from Q1 to Q2.
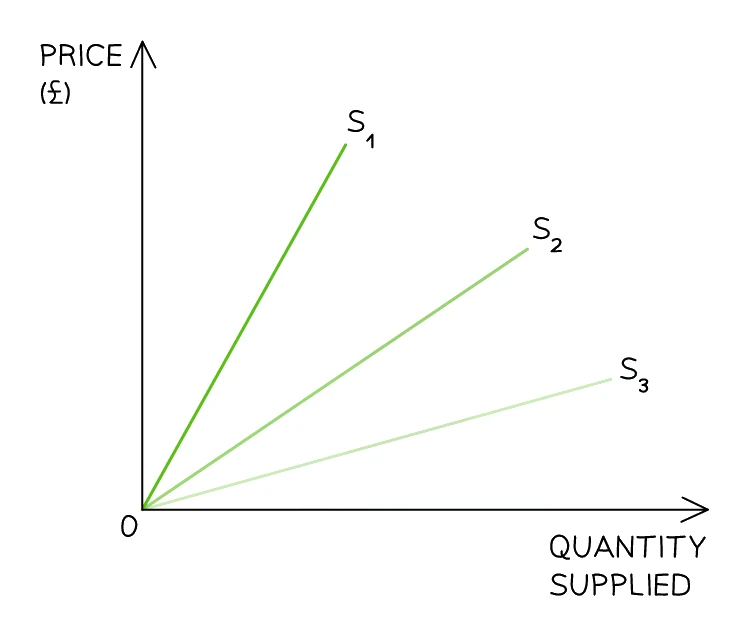
A unit elastic supply curve is any straight line drawn through the origin: whatever its slope, the percentage change in quantity supplied always equals the percentage change in price, so PES = 1 along the whole curve.
A relatively elastic supply curve is shallow: the same rise in price from P1 to P2 produces a larger proportional rise in quantity supplied from Q1 to Q2.
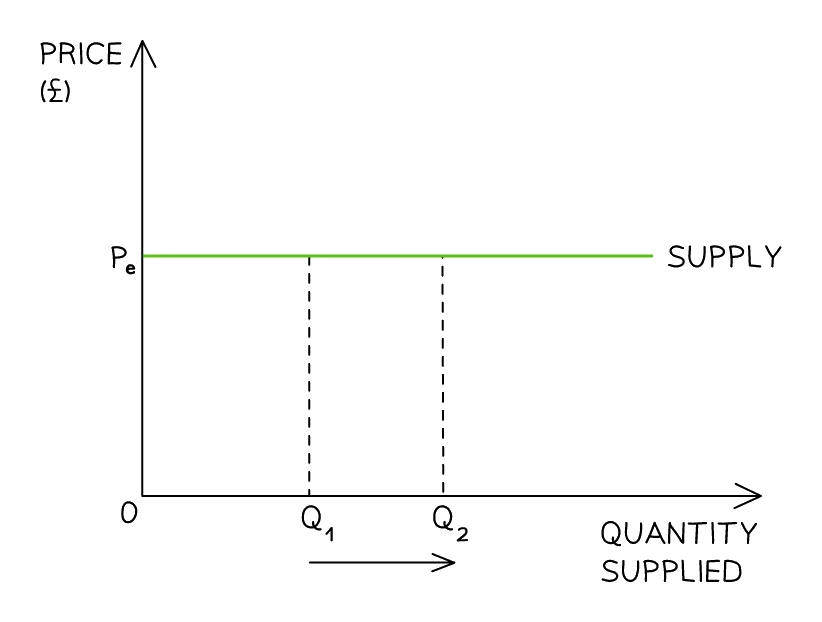
A perfectly elastic supply curve is horizontal: producers will supply any quantity at price Pe, from Q1 to Q2, but nothing at all below it.