Market Equilibrium & Price Mechanism
Allocation of Resources · 4 question types
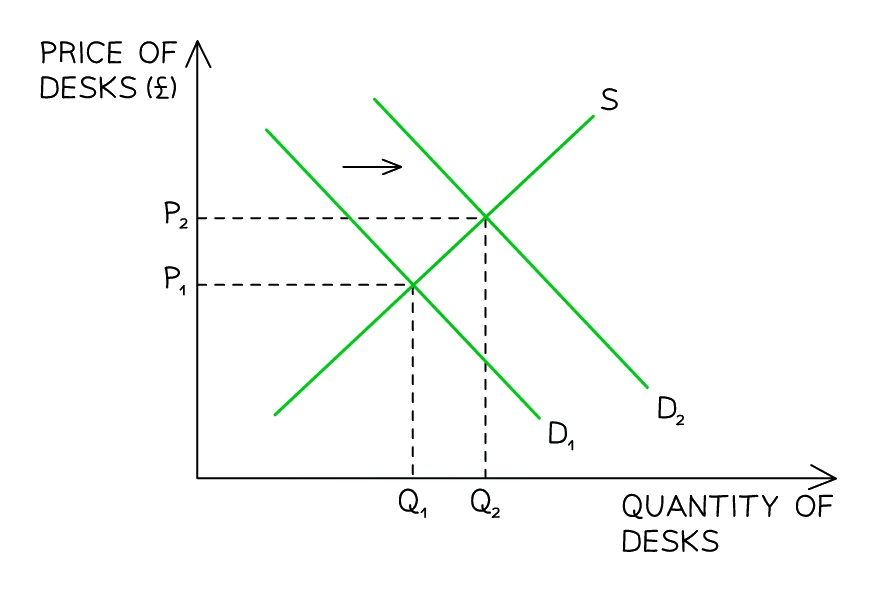
The conditions of demand (topic 4) and supply (topic 5) can change at any time. Any shift in either curve moves the equilibrium price and quantity. There are four basic cases. The diagram above shows one of them: an increase in demand shifts the demand curve right, pushing both the equilibrium price and quantity up.
| Shift | Effect on equilibrium price | Effect on equilibrium quantity |
|---|---|---|
| Demand shifts right (increase in demand) | Rises (P ↑) | Rises (Q ↑) |
| Demand shifts left (decrease in demand) | Falls (P ↓) | Falls (Q ↓) |
| Supply shifts right (increase in supply) | Falls (P ↓) | Rises (Q ↑) |
| Supply shifts left (decrease in supply) | Rises (P ↑) | Falls (Q ↓) |
Two patterns to memorise:
- A shift in demand moves price and quantity in the same direction (both up or both down).
- A shift in supply moves price and quantity in opposite directions.
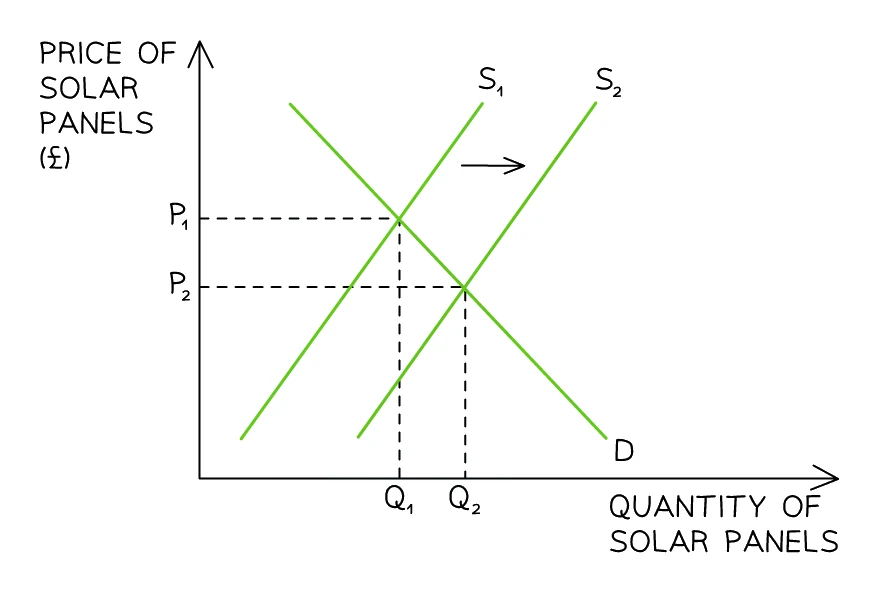
Causes and consequences of price changes
The four cases above are the causes of a price change: the equilibrium price moves only because a condition of demand or a condition of supply has changed and shifted one of the curves. A rise in demand or a fall in supply pushes the equilibrium price up; a fall in demand or a rise in supply pulls it down.
The consequence of that price change shows up in the quantity actually traded (the good's sales). Because a curve has shifted, the new equilibrium sits at a different quantity, and the size of that change in sales depends on how responsive the other side of the market is.
- A higher equilibrium price (from a demand rise or supply fall) is matched by a larger quantity traded when demand rises, but a smaller quantity traded when supply falls.
- A lower equilibrium price (from a demand fall or supply rise) is matched by a smaller quantity traded when demand falls, but a larger quantity traded when supply rises.
A useful way to read this: the price change is the visible signal, and the change in sales is the real-world effect it produces in the market. The four-case table above tells you both at once.
A seven-step structure for "analyse" questions
Most "analyse the effect of X on the equilibrium" questions are worth 4–6 marks. The mark scheme rewards a systematic walkthrough. The structure works for any shift in any market.
Step 1. Decide which side of the market the scenario affects: demand or supply.
Step 2. State which curve shifts and in which direction (e.g. "D shifts right from D₁ to D₂").
Step 3. At the original price, name the disequilibrium that now exists (surplus or shortage).
Step 4. State whether sellers raise or lower the price to clear the disequilibrium.
Step 5. Explain the contraction or extension of the other curve that follows the price change.
Step 6. Identify the new equilibrium (P₂, Q₂).
Step 7. Compare the new equilibrium to the original and conclude whether price and quantity have ended up higher or lower.
When both demand and supply shift
If both curves shift at the same time, one of the two equilibrium effects becomes ambiguous and depends on the relative size of the two shifts.
| Both shifts | Definite effect | Ambiguous effect |
|---|---|---|
| D right + S right | Q ↑ (definite) | P depends on which shifts more |
| D left + S left | Q ↓ (definite) | P depends on which shifts more |
| D right + S left | P ↑ (definite) | Q depends on which shifts more |
| D left + S right | P ↓ (definite) | Q depends on which shifts more |
Both-curve analysis is only occasionally required, but the rule is: one of P or Q is determined; the other is "ambiguous" and depends on relative shift size.
Analyse, using a demand and supply diagram, the effect of [event] on [market]
What comes up: A 4–5 mark question asks you to draw a D&S diagram and explain the new equilibrium after one curve shifts.
Write: Your answer has two parts — the diagram earns up to 4 marks, and a written sentence earns the final mark. For the diagram: (1) label both axes (price and quantity, or P and Q); (2) draw and label the original D and S curves; (3) draw the shifted curve in the correct direction (left or right) and label it D₂ or S₂; (4) show both equilibrium points with reference lines P₁/Q₁ and P₂/Q₂ (or mark points E₁ and E₂). For the written analysis: state the causal link — for example, if costs of production rise, supply shifts left, price rises, and quantity traded falls.
Watch out: The diagram marks and the written analysis mark are separate: drawing a correct diagram without any written explanation leaves the final mark on the table. Also, make sure you shift only the curve affected by the scenario — shifting both D and S in a single-shift question scores nothing for either shift.