Exam Frequency Analysis
Past paper frequency (2018 to 2024)
This topic accounts for approximately 20% of your exam marks.
stable
Very High
Stable20%
Demand is the single highest-frequency topic; demand definition, curve shifts, and factors appear on virtually every Paper 2, typically worth 10 to 18 marks.
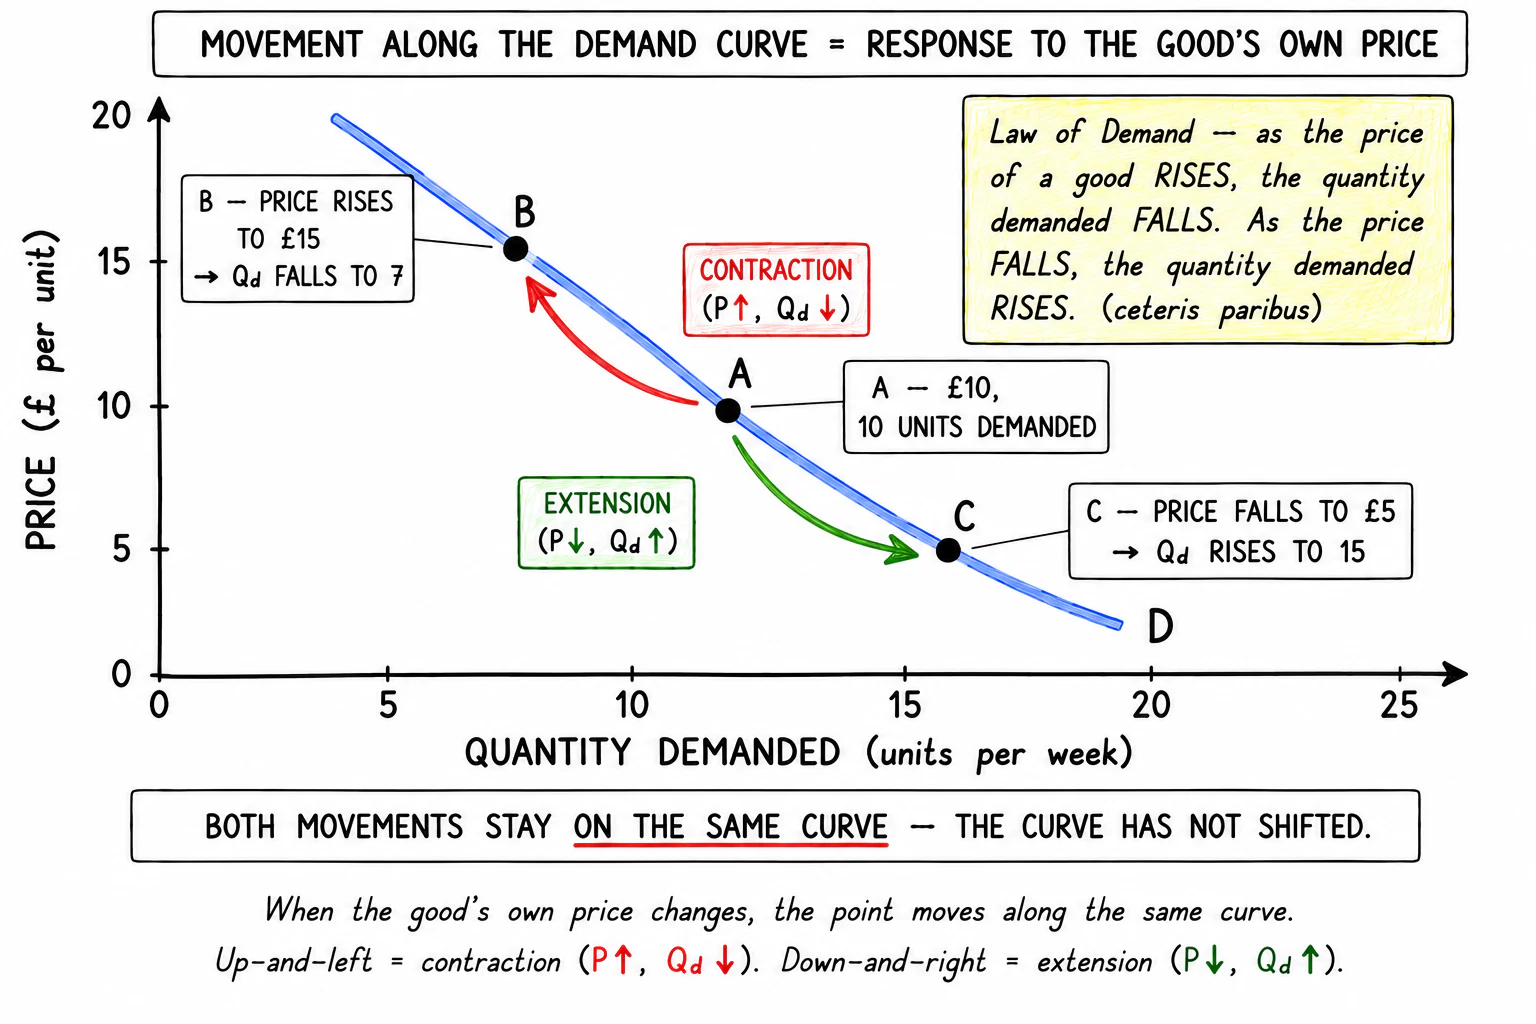
A plots the quantity of a good consumers are willing and able to buy (horizontal axis) against the price (vertical axis). In practice, exam diagrams use a straight line that slopes downward from upper-left to lower-right, even though real data would form a curve. The straight-line shortcut makes the diagram easier to draw and read.
Standard layout of every demand-curve diagram in the exam.
- Vertical axis: price (usually in £ or $ per unit).
- Horizontal axis: quantity demanded per period (e.g. units per week).
- Curve label:
Dfor the demand curve. Shifts toD₁(right) orD₂(left) when the curve moves.