Exam Frequency Analysis
Past paper frequency (2018 to 2024)
This topic accounts for approximately 20% of your exam marks.
stable
Very High
Stable20%
Demand is the single highest-frequency topic; demand definition, curve shifts, and factors appear on virtually every Paper 2, typically worth 10 to 18 marks.
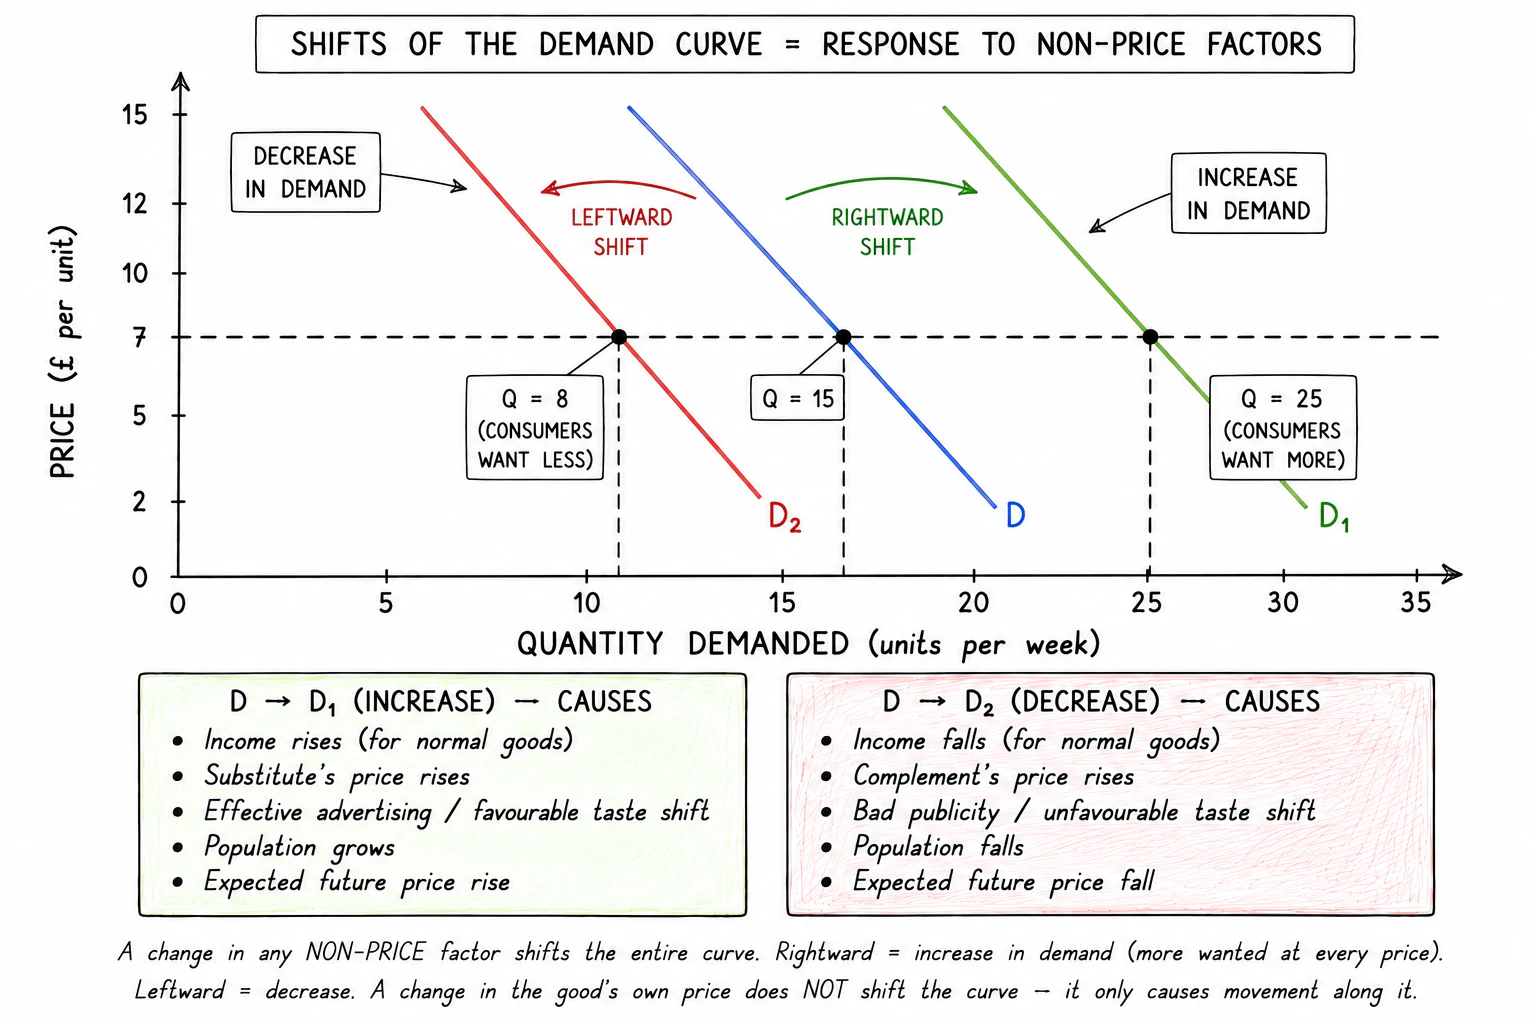
A change in any factor other than the good's own price moves the whole curve sideways. The collective name for these non-price factors is the conditions of .
Increase in demand = a rightward shift to a new curve (the curve labelled D₁ in most diagrams). At every price, consumers now want more.
Decrease in demand = a leftward shift to a new curve (D₂). At every price, consumers now want less.
A useful mnemonic: PINETS
Candidates need to be able to name six conditions of demand. The mnemonic PINETS packs them all into one word.
| Letter | Stands for | Effect on demand |
|---|---|---|
| P | Price of related goods | Substitutes: rival's price ↑ → demand for this good ↑. Complements: partner's price ↑ → demand for this good ↓. |
| I | Income | Normal good: income ↑ → demand ↑. Inferior good: income ↑ → demand ↓. |
| N | Number of consumers (population size and structure) | Population ↑ → market demand ↑. Ageing population shifts demand toward goods used by older people. |
Some textbooks use a different mnemonic (PIRATES, JIPSIE, TRAINS). The list of factors is the same; only the order is reorganised. Memorise whichever mnemonic feels natural and apply it consistently.
The conditions of demand in detail
1. Income. The relationship between income and demand depends on the type of good.
- A has a positive relationship: when income rises, demand rises (cars, restaurant meals, branded clothes). Most goods are normal.
- An has a negative relationship: when income rises, demand falls (supermarket own-brand bread, intercity coach travel where rail and air become affordable). When income falls, demand for inferior goods rises.
2. Price of related goods. Two types:
- Substitutes are goods that can replace each other (tea and coffee, Coca-Cola and Pepsi, Uber and Lyft). When the price of a substitute rises, consumers switch to the other one, so demand for this good rises.
- Complements are goods consumed together (cars and petrol, printers and ink cartridges, game consoles and games). When the price of a complement rises, consumers buy less of the pair overall, so demand for this good falls.
3. Tastes, fashion and advertising. Anything that makes the good more attractive to consumers shifts demand right; anything that makes it less attractive shifts demand left. A successful advertising campaign, a celebrity endorsement, or a positive online trend all raise demand. A health scare, bad press, or a fashion moving on all reduce demand.
4. Expectations of future prices. If consumers expect the price of a good to rise in the near future, they buy more now to lock in the lower price, raising current demand. The reverse is also true: expecting a fall in price makes consumers wait, reducing current demand. This is why announced tax rises on cigarettes or alcohol often produce a short-term spike in current demand.
5. Population size and structure. A larger population means more potential buyers and so a larger market demand at every price. Changes in the structure of population (e.g. an ageing population, a baby boom, net inward migration) shift demand for specific goods: more pensioners means more demand for hearing aids and reduced demand for school uniforms.
6. Government policy. Subsidies that lower a good's price effectively shift the demand curve faced by buyers; taxes that raise the price do the opposite. (Some textbooks treat this as a movement along the curve rather than a shift; either treatment is accepted as long as the candidate is consistent.)
Exam tip
Substitutes and complements: shift, not movement
What comes up: "explain how the price of substitutes and complements affects demand for good X" — typically 4 marks, capped at 3 if only one type is addressed.
Watch out: a change in the price of a related good (a substitute or complement) is a non-price factor, so it shifts the whole demand curve — it is not a "movement along" this good's own curve. Calling it a movement along is the classic error here.