1. An inequality as a region
From a line to an area
- An equation such as y = 2x + 1 is satisfied by the points along one line
- Changing the equals sign to an inequality opens that line out into a whole area of the grid
- Points lying to one side of it satisfy the inequality while those on the other side fail, which is why the answer is a region rather than a line
- An inequality in one letter still describes a region on the grid
- x ⩾ 4 covers everything on or to the right of the vertical line x = 4
- y < 2 covers everything below the horizontal line y = 2, not including the line itself
- Two or more inequalities together describe the area where all of them hold at once, and that overlap is what a question labels R
- Solving inequalities in one letter, and showing them on a number line, is covered under linear equations and inequalities
2. Drawing the boundary lines
Which line, and how to draw it
- Replace the inequality sign with an equals sign and draw that line first
- Draw a solid line when the sign is ⩽ or ⩾, because the points along it are included
- Draw a broken line when the sign is < or >, because the points along it are excluded
- Putting a sloping boundary into y = mx + c makes it far easier to plot
- 2x + y ⩽ 8 has boundary 2x + y = 8, which is y = 8 − 2x, meeting the axes at (0, 8) and (4, 0)
- Extend every line right across the grid you are given, not just as far as the region looks like it goes
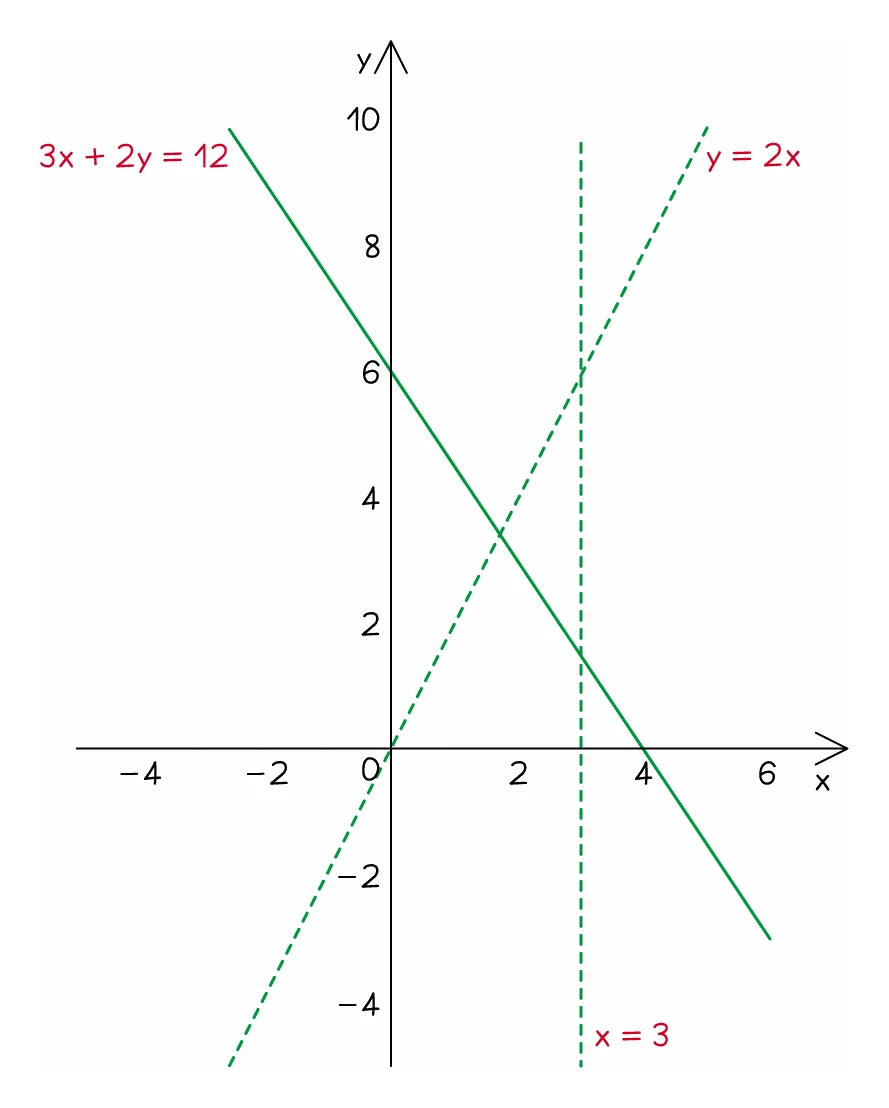
- Each boundary line drawn correctly is worth a mark before any shading happens
Worked example
Choosing the boundary lines
A region is defined by y ⩽ 2x + 1, x > 3 and y ⩾ 0. Describe the three boundary lines you would draw.
Solution:
- Replace each inequality sign with an equals sign to get the boundary
- y ⩽ 2x + 1 gives the line y = 2x + 1, a sloping line through (0, 1) with gradient 2
- The sign is ⩽, which includes the boundary, so that line is drawn solid
- x > 3 gives the line x = 3, a vertical line through 3 on the x-axis
- The sign is >, which excludes the boundary, so that line is drawn broken
- y ⩾ 0 gives the line y = 0, which is the x-axis itself, drawn solid
- Every line is ruled right across the grid, not just along the edge of the region you expect, so that you can see where each pair of lines crosses before you shade
3. Shading the unwanted side
The convention this specification uses
- On this specification you shade the side you do not want, unless a question says otherwise
- Shading away the unwanted parts of every line leaves the region you do want as the one patch of clear grid
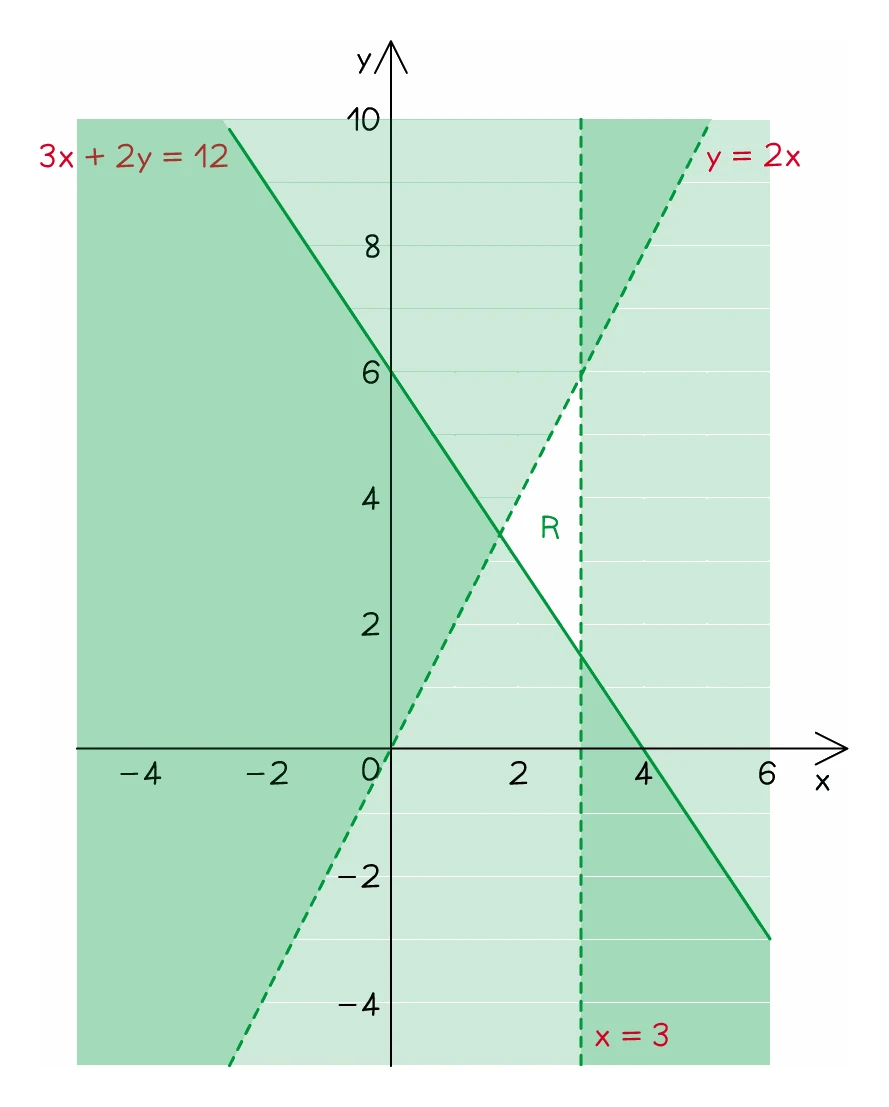
- The alternative, shading what you want, buries the answer under several overlapping layers, which is why the convention runs the other way
- Label the clear patch R. With R labelled the examiner treats the lines around it as your boundaries and ignores the shading, so the label can rescue an answer whose shading is untidy
Deciding which side is unwanted
- For y ⩾ or y >, the wanted side is above the line, so shade below it
- For y ⩽ or y <, the wanted side is below the line, so shade above it
- For x ⩾ or x >, the wanted side is to the right, so shade to the left, and the other way round for x ⩽ and x <
- When you are unsure, pick any point clearly off the line, substitute it, and see whether the statement comes out true
- The origin is the easiest test point whenever the line does not pass through it
Worked example
Drawing a region from three inequalities
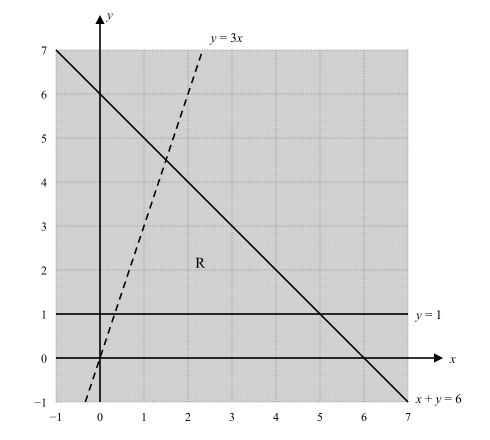
Shade the unwanted regions to show the region R where y ⩾ 1, x + y ⩽ 6 and y < 3x all hold, and label R.
Solution:
- Draw y = 1 as a solid horizontal line, since the sign is ⩾
- Draw x + y = 6 as a solid line through (0, 6) and (6, 0), since the sign is ⩽
- Draw y = 3x as a broken line through the origin, since the sign is <
- For y ⩾ 1 the wanted side is above, so shade below y = 1
- For x + y ⩽ 6 test the origin: 0 + 0 ⩽ 6 is true, so the origin is wanted and the far side is shaded
- For y < 3x the origin sits on the line, so test (1, 0) instead: 0 < 3 is true, so (1, 0) is wanted and the other side is shaded
- One clear triangle is left, with corners near (⅓, 1), (5, 1) and (1.5, 4.5)
- Label that clear triangle R
- Check with a point inside it, such as (2, 2): 2 ⩾ 1, 2 + 2 ⩽ 6 and 2 < 6 all hold
4. Reading the inequalities off a region
Working backwards
- The reverse question shows a region already marked R and asks which inequalities define it
- Start by identifying the equation of every line that bounds the region, leaving the inequality signs aside for the moment
- A vertical line is x = k and a horizontal line is y = k
- A sloping line needs its gradient and where it meets the vertical axis, giving y = mx + c
- Getting those equations right earns marks by itself, even before any inequality sign is decided
- Then turn each equation into an inequality by looking at where R lies relative to that line
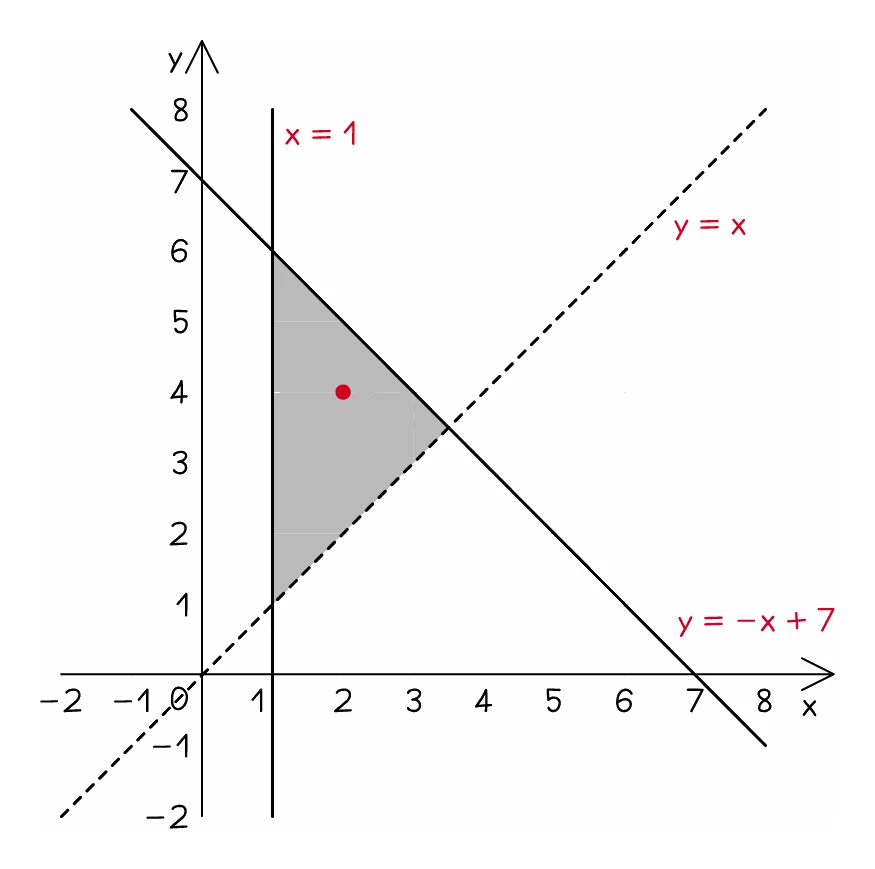
- Solid means ⩽ or ⩾ and broken means < or >, so the style of the line settles which pair of signs to use
- Confirm every one by substituting the coordinates of a point inside R, which takes seconds and catches a reversed sign
Worked example
Finding the inequalities that define a region
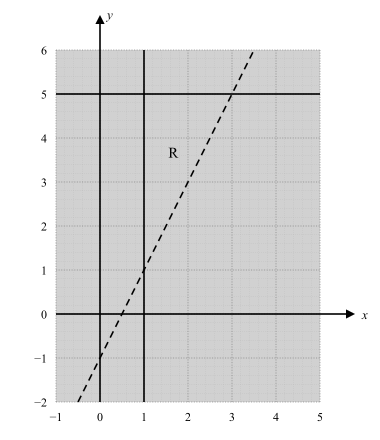
A region R is bounded by a solid vertical line at x = 1, a solid horizontal line at y = 5, and a broken line through (0, −1) and (2, 3). R lies to the right of the vertical line, below the horizontal one, and above the sloping one. Write down the three inequalities.
Solution:
- The vertical line gives x = 1, and R is to the right of a solid line, so x ⩾ 1
- The horizontal line gives y = 5, and R is below a solid line, so y ⩽ 5
- The sloping line rises 4 for a run of 2, so its gradient is 2, and it meets the vertical axis at −1, giving y = 2x − 1
- R is above that line and the line is broken, so y > 2x − 1
- The three inequalities are x ⩾ 1, y ⩽ 5 and y > 2x − 1
- Check with (2, 4), a point inside R: 2 ⩾ 1, 4 ⩽ 5 and 4 > 3 all hold