1. Scatter diagrams
Plotting two quantities together
- A scatter diagram plots pairs of measurements taken from the same thing, one quantity on each axis
- Each item of data gives one point, so twelve people measured for two things gives twelve points
- The syllabus asks for points to be clearly marked, for example as small crosses, and they are never joined up
- Questions frequently give a diagram with most points already plotted and ask you to add the last few
- Read the scale on both axes before plotting, since the two axes rarely use the same one
2. Correlation
The three types
- Correlation describes whether the two quantities tend to change together, and in which direction
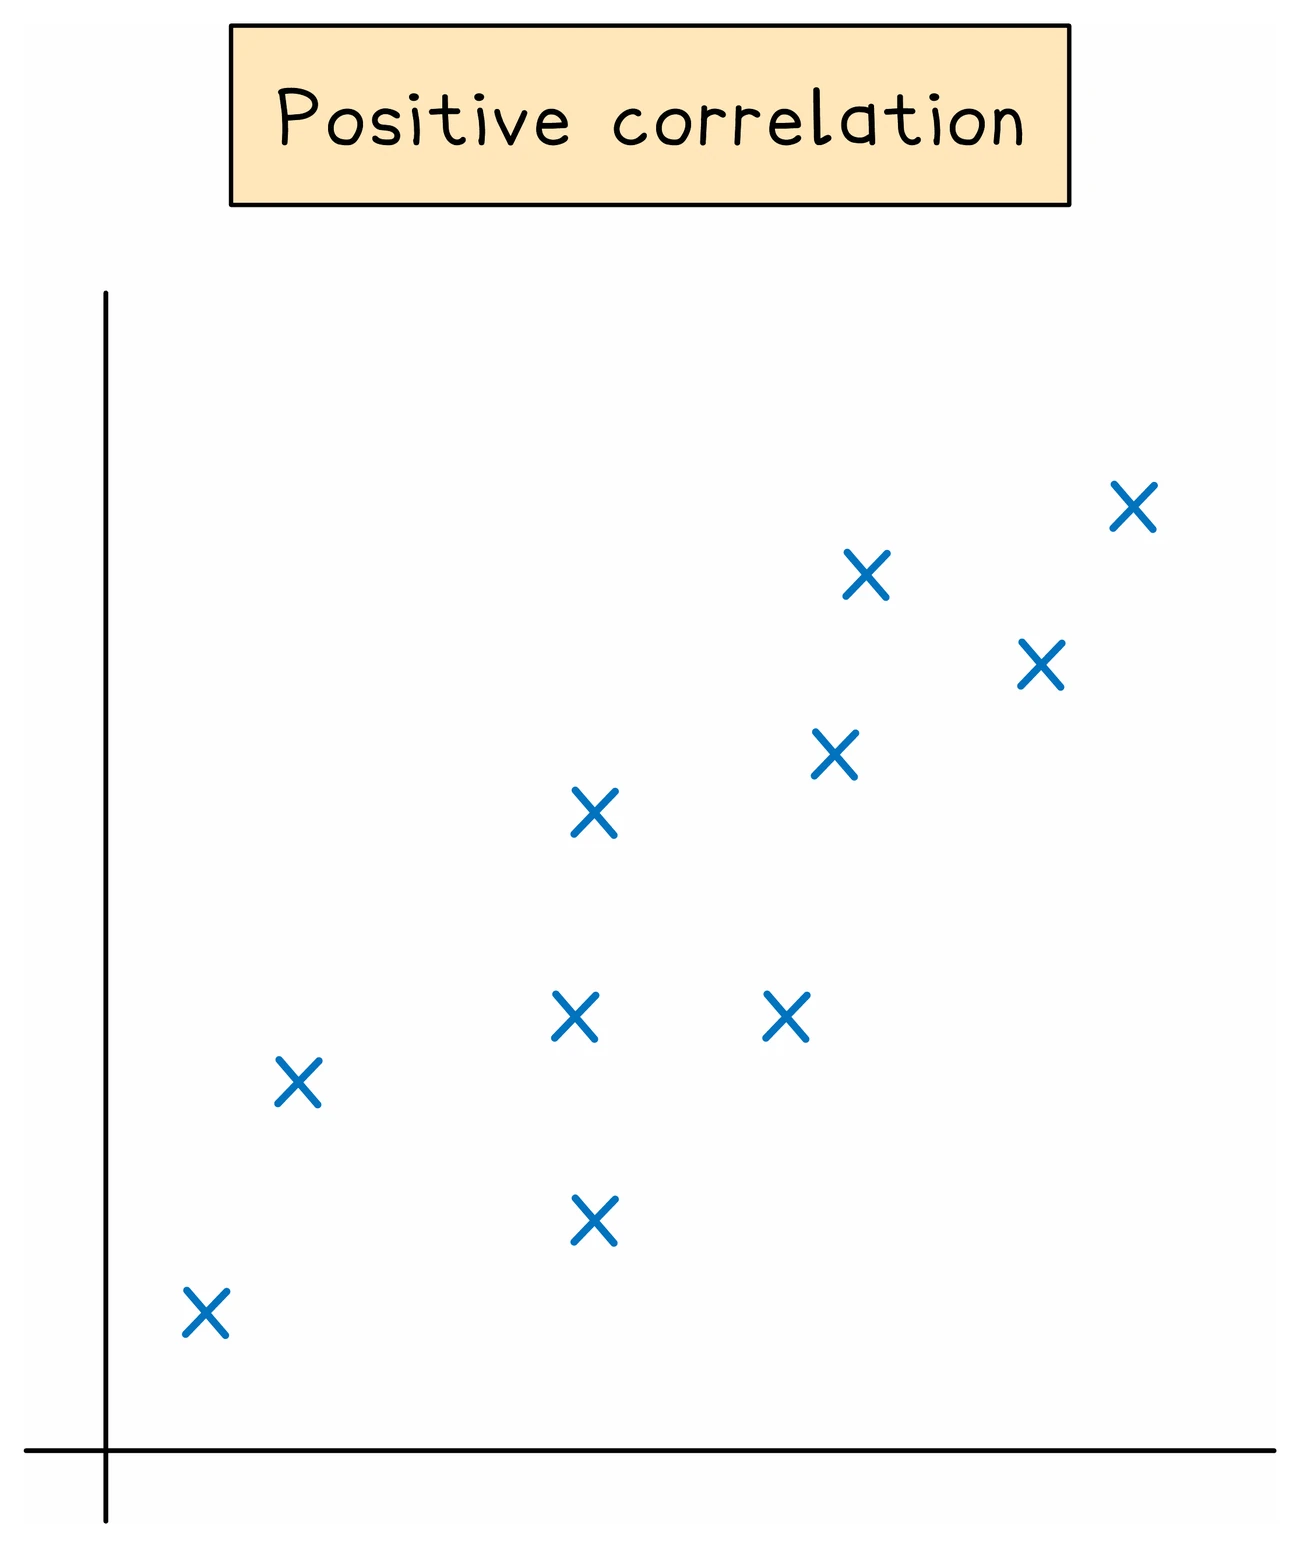
- Positive correlation: both quantities rise together, and the points climb as you read left to right
- Temperature and the number of cold drinks sold
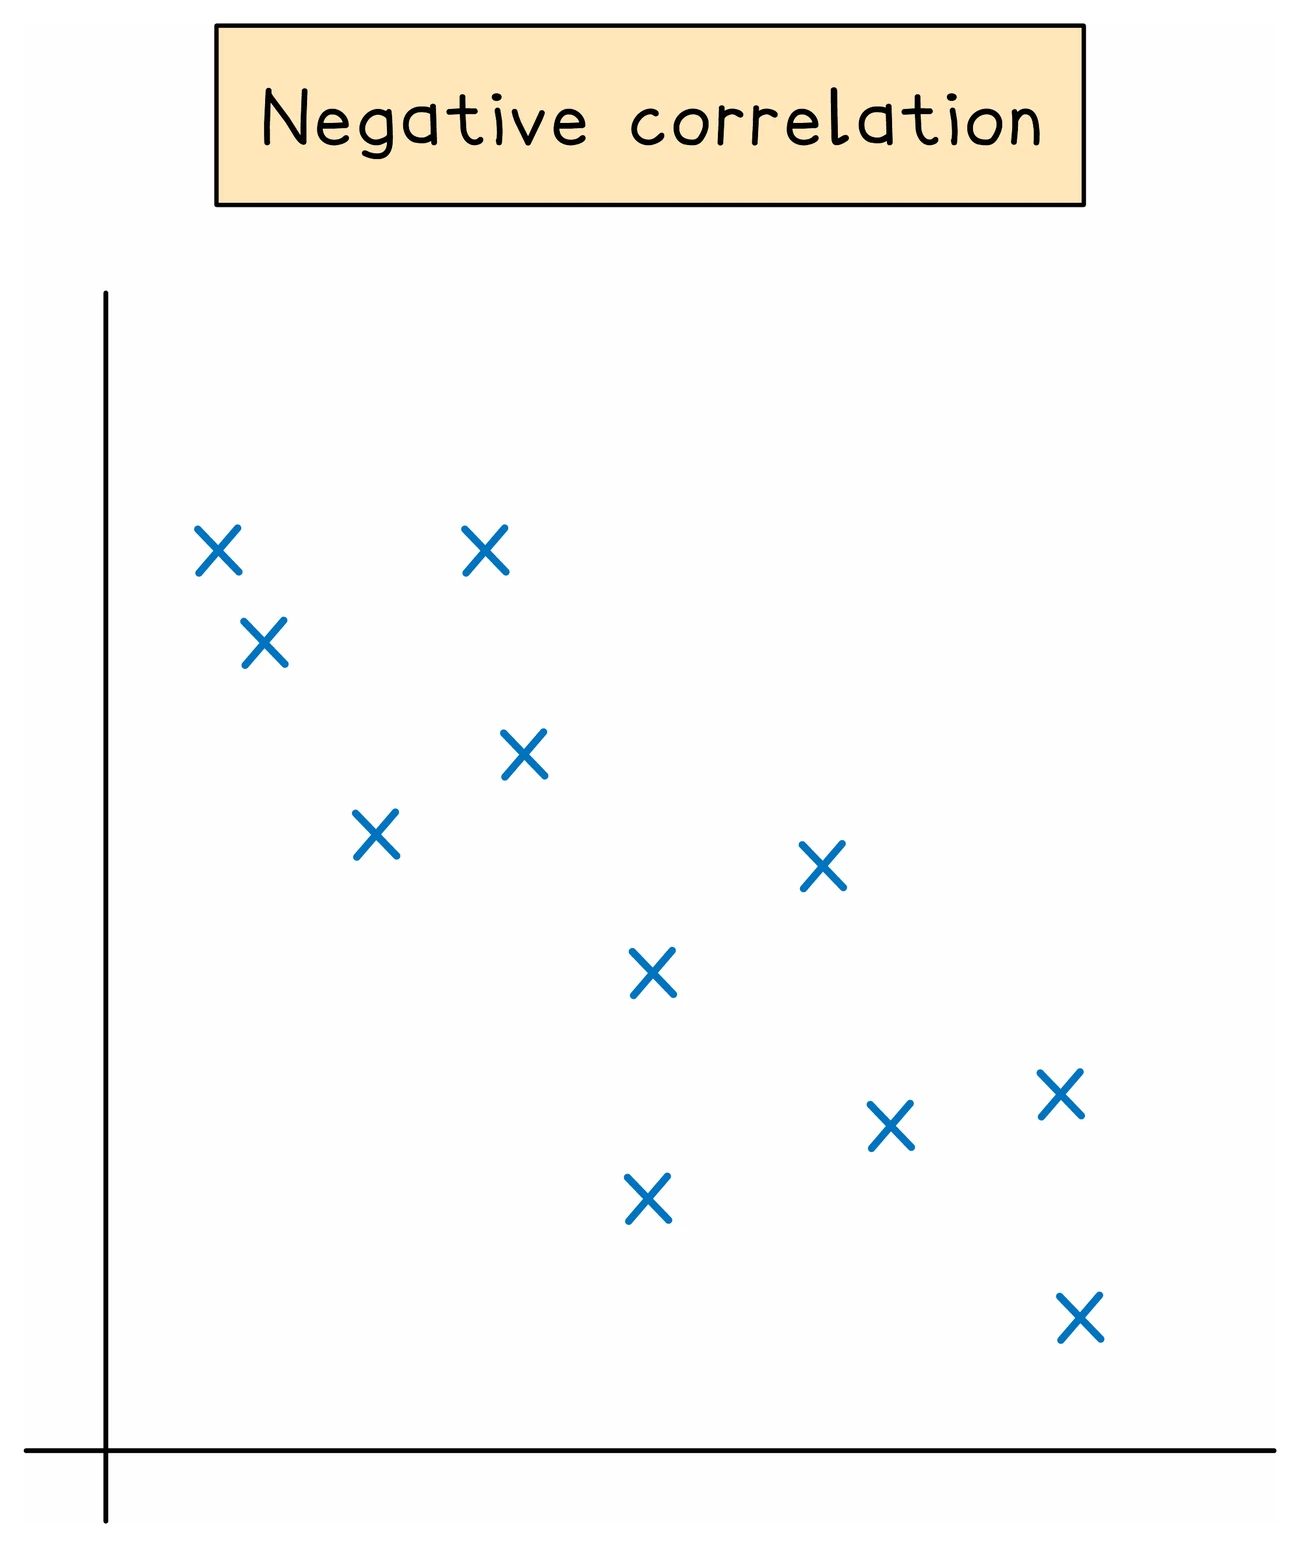
- Negative correlation: one rises while the other falls, and the points descend as you read left to right
- The age of a car and its value
- Zero correlation: no relationship, and the points form a shapeless cloud
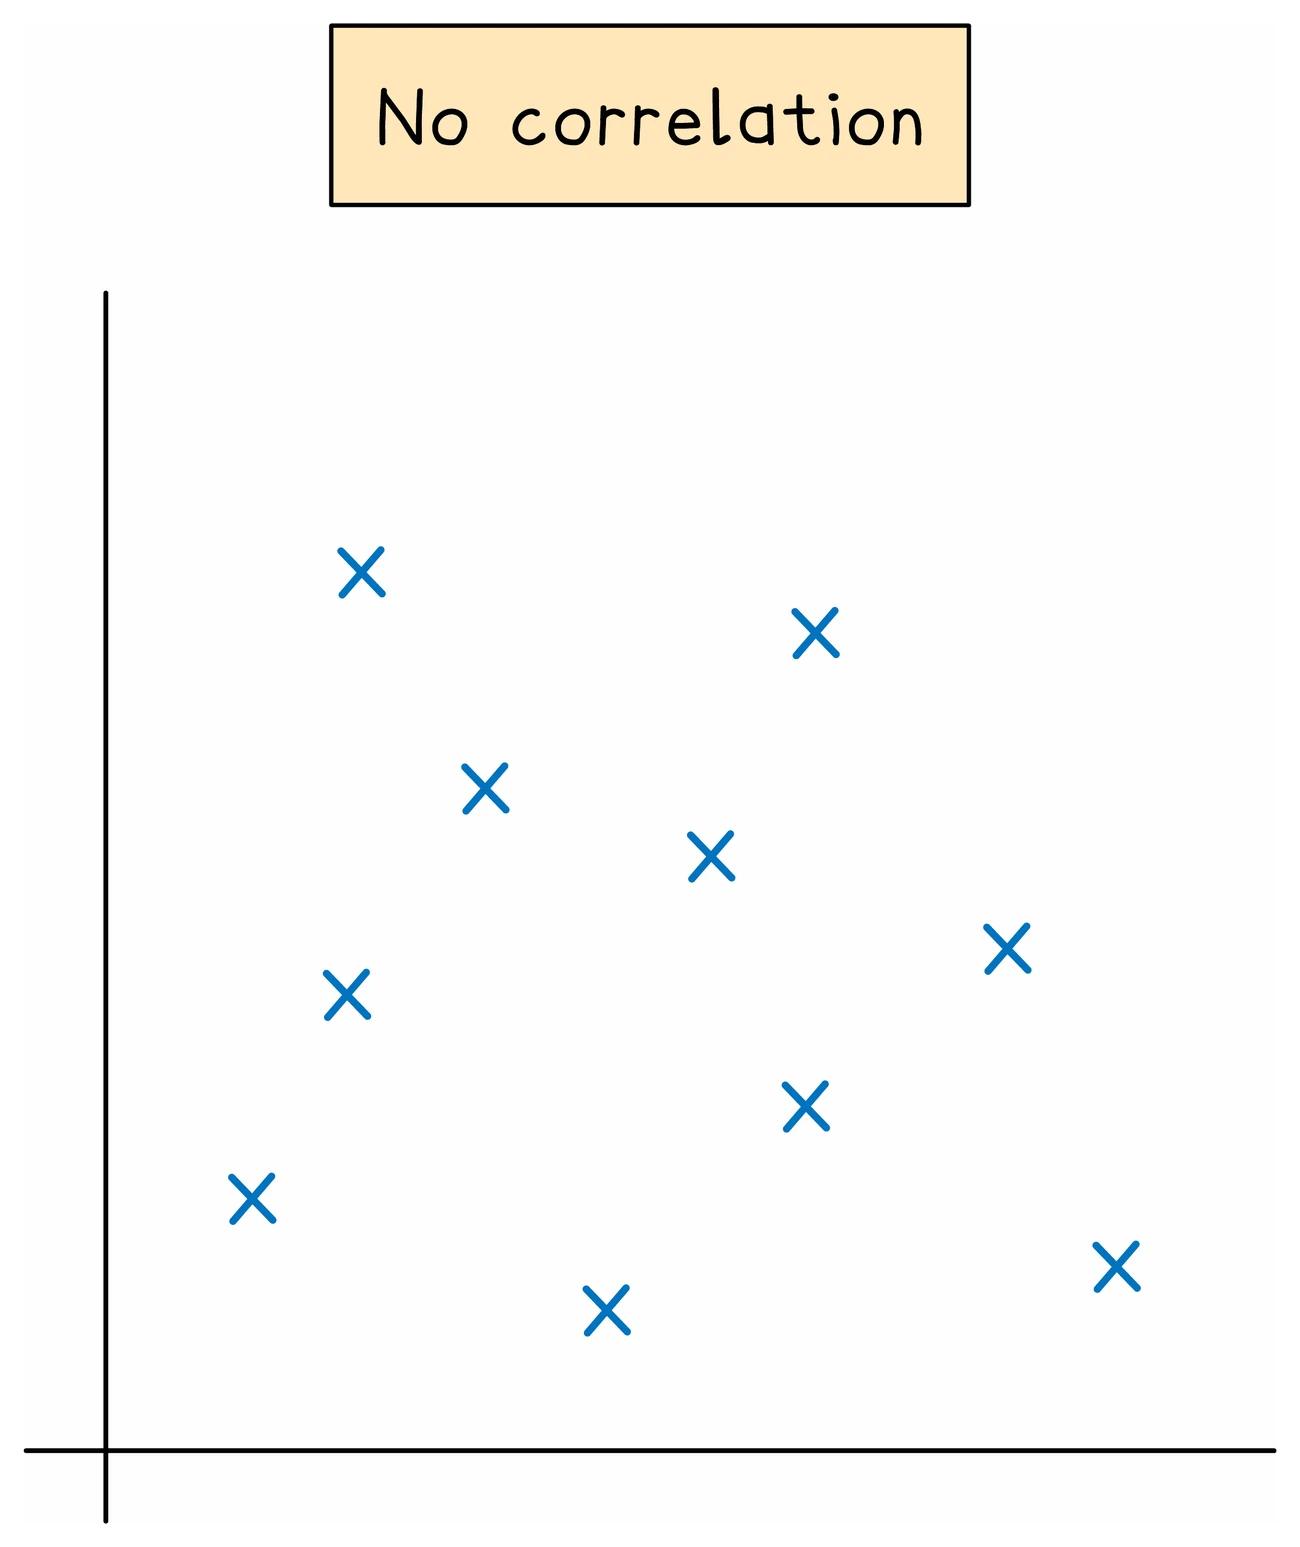
- Correlation can also be described as strong or weak, according to how closely the points cluster around a straight line
Describing it in context
- The standard question asks what type of correlation the diagram shows, for one mark, and the answer is one of those three phrases
- A follow-up may ask you to describe the relationship, which needs the two quantities named rather than just the word
- "As the temperature increases, the number of people on the beach increases"
- Correlation does not prove that one quantity causes the other: both may be driven by something else entirely, and the syllabus asks you to appreciate such restrictions on drawing conclusions
Worked example
Naming and describing correlation
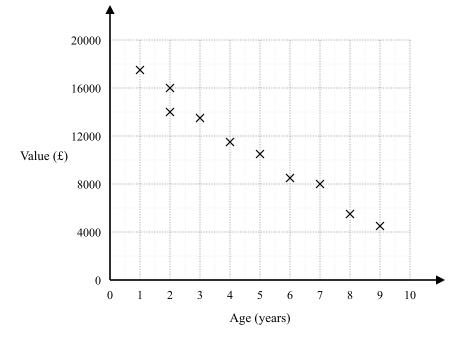
A scatter diagram plots the age of a car in years against its value in pounds. The points fall from the top left towards the bottom right. Name the correlation and describe what it means.
Solution:
- The points descend as you read from left to right, so as one quantity rises the other falls
- The type is negative correlation
- Naming it is one mark; describing it is a separate demand and needs both quantities named
- In context: as the age of a car increases, its value decreases
- "The points go down" is not a description, because it names neither quantity
- Note that this shows a relationship only: correlation on its own never establishes that age causes the fall in value
3. Line of best fit
Drawing one
- Once a diagram has been seen to slope one way or the other, its trend can be summarised by a line of best fit
- The syllabus is precise about what it must look like
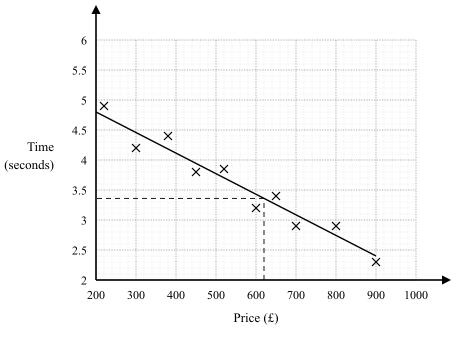
- A single ruled straight line, drawn by inspection with a ruler
- It must extend across the full data set, not just the middle
- It need not pass through any of the points, but the points should be roughly evenly distributed on either side along its whole length
- Where one point clearly sits away from the pattern, an outlier, ignore it when placing the line
- Never draw a curve, and never join the points
Using one
- The line lets you estimate one quantity from the other: go from the known value straight to the line, then turn and read the other axis (up then across from the horizontal axis, across then down from the vertical axis)
- Estimating within the range of the data is interpolation, and it is reasonably reliable
- Estimating beyond the data is extrapolation, and it is unreliable because the trend may not continue
- If a question asks whether an estimate is reliable, check whether the value lies inside the plotted range: outside it, the estimate is unreliable
Exam tip
Read the estimate from your own line
Rule your line first, then take the estimate from that line, not from the table or the nearest cross: draw a line from the given value to your line, then turn to the other axis. The estimate mark follows through from your own line, but the schemes tie it to a straight line sloping the same way as the points, so a curve or a zigzag joining the crosses loses it along with the mark for the line.
Worked example
Reading an estimate from a line of best fit
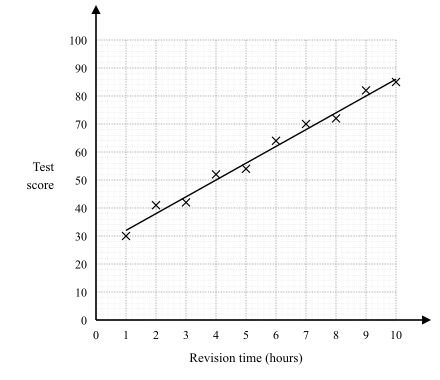
A scatter diagram plots revision time in hours against test score for students who revised for between 1 and 10 hours. The line of best fit passes through (2, 38) and (8, 74). Estimate the score for a student who revises for 5 hours, and interpret the gradient.
Solution:
- The line rises from 38 to 74 as the hours go from 2 to 8
- Change in score = 74 − 38 = 36, over a change of 8 − 2 = 6 hours
- Gradient = 36 ÷ 6 = 6
- Five hours is 3 hours beyond (2, 38), so the score rises by 3 × 6 = 18
- Estimated score = 38 + 18 = 56
- On the diagram itself, the same estimate comes from going up from 5 on the hours axis to the line, then across to the score axis
- The gradient means that each extra hour of revision is associated with about 6 more marks
- Five hours lies inside the plotted range, so this is interpolation and reasonably reliable