1. Recognising the standard shapes
The families you must know
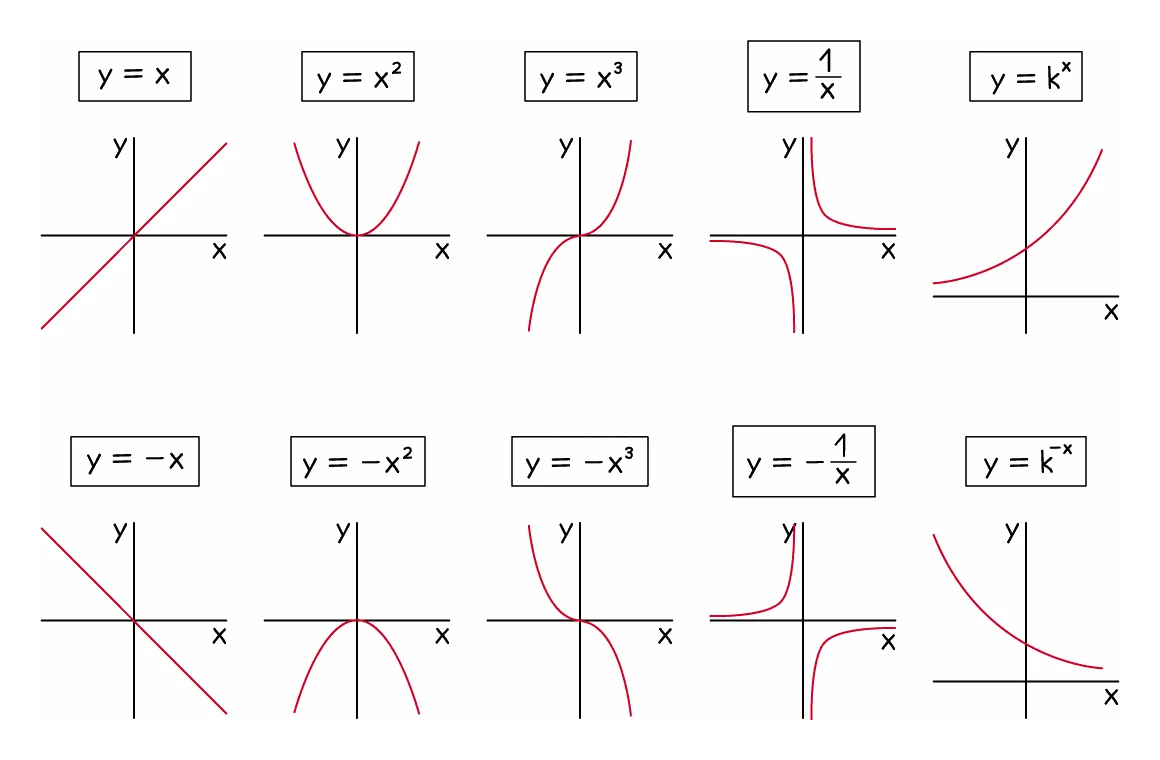
- Being able to match an equation to the right picture saves plotting and catches plotting errors
- Linear, written y = mx + c, or equivalently as ax + by = c, is a straight line
- Quadratic, written y = ax² + bx + c, is a single u-shape or n-shape with one turning point
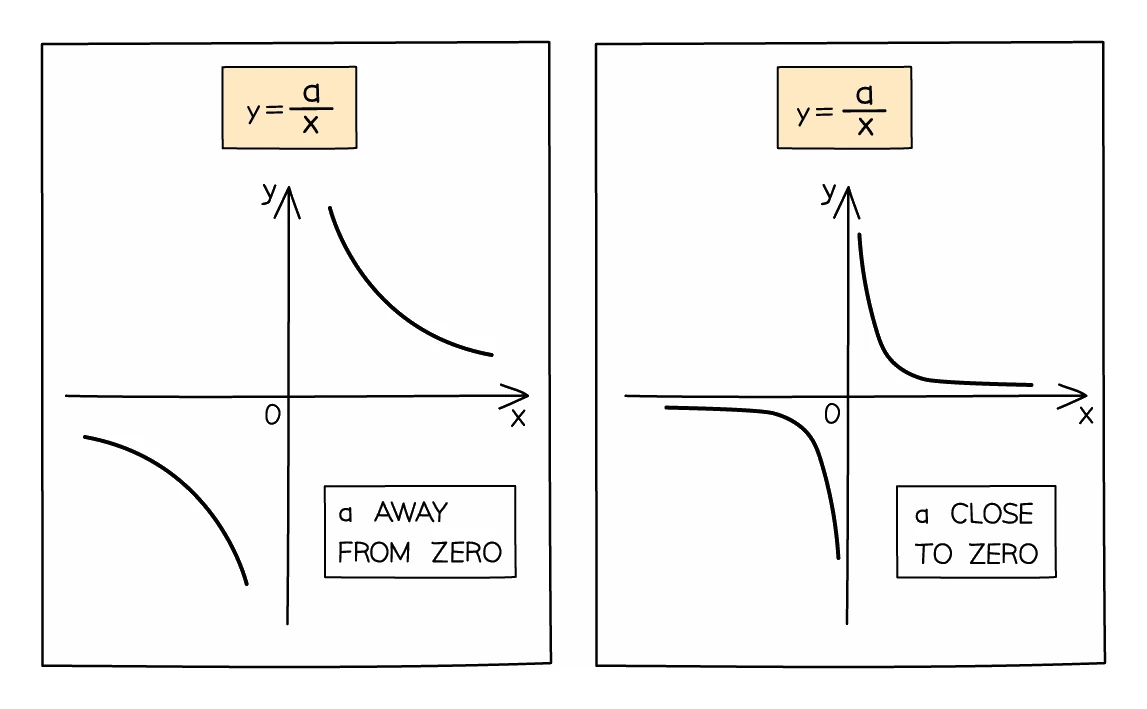
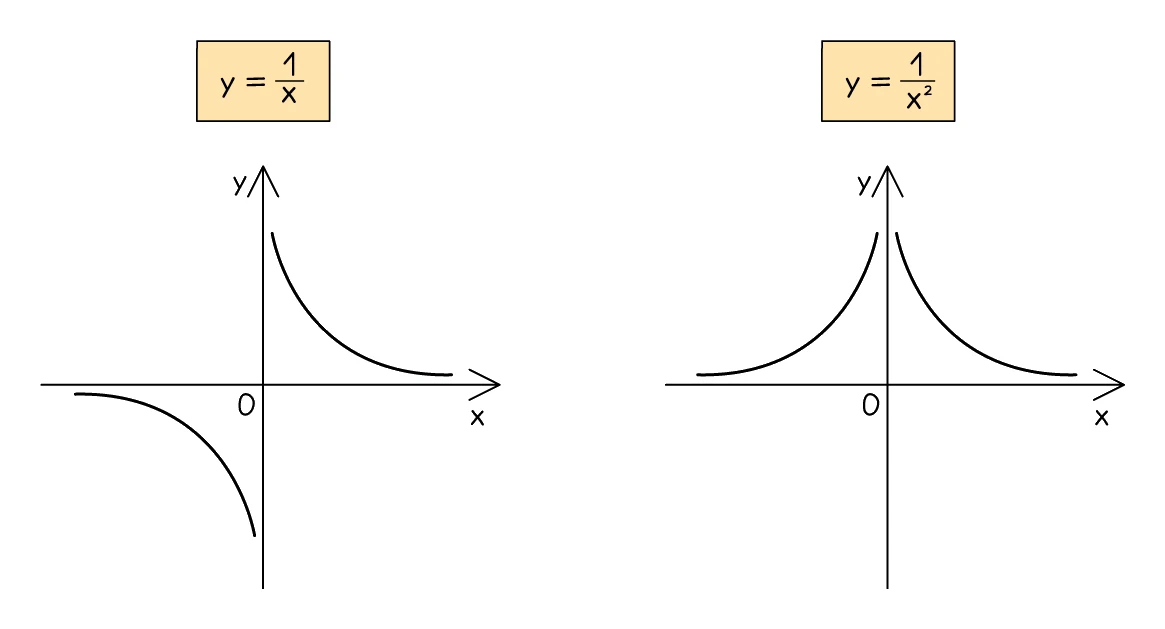
- Reciprocal, written y = a ÷ x or y = a ÷ x + b, is two separate branches that never meet the y-axis, and y = a ÷ x never meets the x-axis either
- Cubic, written y = ax³ + b or y = ax³ + bx² + cx, has a long S-like sweep and can turn twice
- Exponential, written y = akˣ + b with x in the power, climbs or falls ever more sharply and flattens towards a horizontal line
- The sign of the leading number reflects each shape vertically, so a negative cubic falls where a positive one rises
Fractional powers
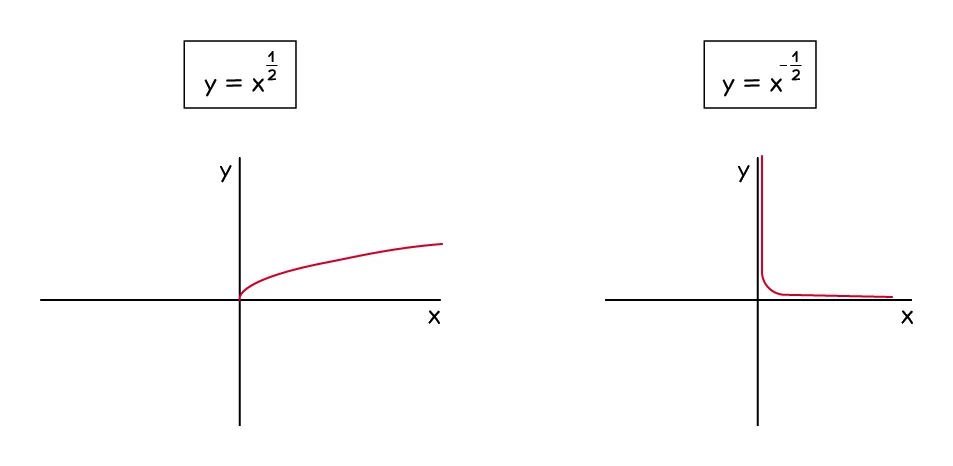
- Two further shapes appear because this specification allows powers of ½ and −½
- The power ½ gives y = √x, a curve that starts at the origin and rises ever more gently
- The power −½ gives y = 1 ÷ √x, a curve that drops steeply away from the y-axis and flattens towards the x-axis
- Neither exists for negative x, so both curves live entirely to the right of the y-axis
Worked example
Matching an equation to its shape
Say what shape each of these graphs has: (a) y = 2x + 3 (b) y = x² − 4 (c) y = 6/x (d) y = 3ˣ
Solution:
- Read the highest power of x first, because that is what fixes the family
- (a) The highest power is 1, so it is a straight line, sloping up with gradient 2
- (b) The highest power is 2, so it is a parabola, u-shaped because the number in front of x² is positive
- (c) x is on the bottom of a fraction, so it is a reciprocal graph: two separate branches, one in each of two opposite quadrants
- (d) x is in the index, not the base, so it is an exponential graph: it never touches the x-axis and climbs ever more steeply
- The difference between (b) and (d) is exactly which position x occupies, and reading y = 3ˣ as a cubic is the standard slip
Worked example
Where a cubic meets the axes
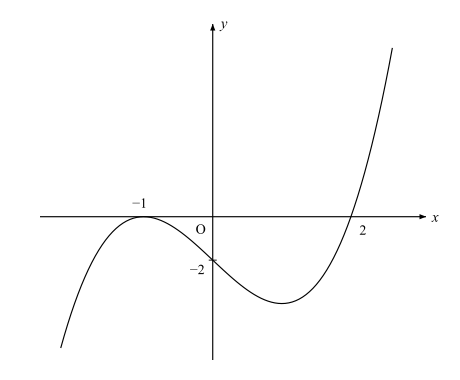
(a) Sketch the graph of y = (x − 2)(x + 1)², showing the values where it meets the axes.
(b) Find the exact x-coordinates of the three points where the graph of y = x³ − 6x crosses the x-axis.
Solution:
- (a) y = 0 when a factor is zero: x − 2 = 0 gives x = 2, and x + 1 = 0 gives x = −1
- The factor (x + 1) is squared, so x = −1 is a repeated root: the curve touches the x-axis there and turns back instead of crossing it
- At x = 0, y = (0 − 2) × (0 + 1)² = −2, so the curve cuts the y-axis at (0, −2)
- Multiplied out, the first term is +x³, so this is a positive cubic: it rises from the bottom left and leaves at the top right
- So the curve climbs to touch the axis at (−1, 0), falls through (0, −2) to a minimum, then rises to cross the axis at (2, 0)
- Label −1 and 2 on the x-axis and −2 on the y-axis
- (b) Take out the common factor x: x³ − 6x = x(x² − 6) = 0
- Either x = 0, or x² = 6, which gives x = √6 or x = −√6
- The crossing points have x-coordinates −√6, 0 and √6, left exact as the question asks
2. Completing a table of values
Substituting carefully
- A table question gives the equation and a row of x values, and asks for the matching y values
- Some entries are already filled in, and those are worth checking against your own working as a test of your method
- Bracket every negative x value as you substitute, then apply the order of operations
- For y = 5 − 2x² at x = −3: y = 5 − 2 × (−3)² = 5 − 2 × 9 = −13
- A squared term turns a negative input positive, while a cubed term keeps it negative
- The calculator's table function will generate the whole row at once from the function, the start value, the end value and the step
- A reciprocal term has no value at x = 0, so that cell stays empty rather than being filled with a zero
Worked example
Filling in a row of values
Fill in the missing y values in the table for y = x² − 3x + 1.
| x | −1 | 0 | 1 | 2 | 3 | 4 |
|---|---|---|---|---|---|---|
| y | 5 | −1 |
Solution:
- At x = 0: 0 − 0 + 1 = 1
- At x = 1: 1 − 3 + 1 = −1
- At x = 3: 9 − 9 + 1 = 1
- At x = 4: 16 − 12 + 1 = 5
- Check a given entry the same way, bracketing the negative: at x = −1, (−1)² − 3 × (−1) + 1 = 1 + 3 + 1 = 5, which matches the table
- The completed row is 5, 1, −1, −1, 1, 5
- The values repeat symmetrically, so the line of symmetry lies half way between x = 1 and x = 2, at x = 1.5
Plotting and drawing
- Plot each pair as a cross, accurate to within half a small square
- Join the points with a single smooth freehand curve, never with a ruler and never as a series of straight segments
- Let the expected shape guide you: a quadratic must be symmetrical, and a reciprocal comes in two separate branches
- A point that sits off the pattern is almost always an arithmetic slip, so recheck it before drawing through it
- Read the axis scales before plotting, since the two axes rarely use the same one
3. Asymptotes
Lines the curve approaches but never reaches
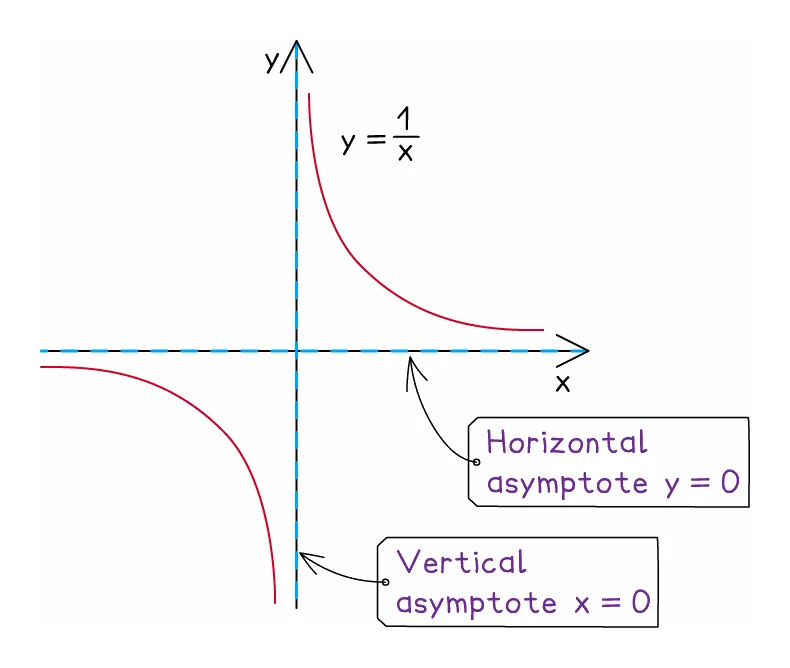
- An asymptote is a straight line that a curve gets closer and closer to without ever touching
- Two of them belong to y = a ÷ x: the y-axis, x = 0, and the x-axis, y = 0
- The vertical one comes from the value that would make the bottom zero
- The horizontal one is where the curve settles as x grows very large in either direction
- Adding a constant lifts the whole curve, so y = a ÷ x + b has the horizontal asymptote y = b while the vertical one stays at x = 0
- For positive a, the curve y = a ÷ x² is always positive and both branches sit above the x-axis, unlike y = a ÷ x whose branches sit in opposite quadrants
Exponential curves
- The curve y = kˣ passes through (0, 1) whatever k is, and has the single asymptote y = 0
- It grows when k is greater than 1 and decays towards zero when k lies between 0 and 1
- Stretching and shifting gives y = akˣ + b, which meets the y-axis at (0, a + b) and has asymptote y = b
- In a growth or decay context, b is the value the quantity settles at in the long run and a + b is its starting value
- Asymptotes are written as equations of lines, so the answer is x = 0 or y = 3, never a bare number
Worked example
Writing down the asymptotes
Write down the equations of the asymptotes of y = 6/x, and of y = 2ˣ + 3.
Solution:
- An asymptote is a line the curve approaches but never meets, and it is written as an equation, not a number
- For y = 6/x, no value of y comes from x = 0, because dividing by zero is undefined
- So the curve never crosses the vertical line x = 0, which is the y-axis
- However large x becomes, 6/x shrinks towards zero without reaching it
- So the curve never meets y = 0, which is the x-axis
- For y = 2ˣ + 3, the 2ˣ part shrinks towards zero as x becomes large and negative, but never reaches it
- The whole curve therefore stays above 3, getting ever closer to it on the left, giving the asymptote y = 3
- The asymptotes are therefore x = 0 and y = 0 for the first curve, and y = 3 for the second, each given as the equation of a line
4. Using a graph to solve an equation
Reading the answers off
- The solutions of an equation are the x values where two graphs meet
- Where the equation is set equal to zero, the answers are where the curve crosses the x-axis
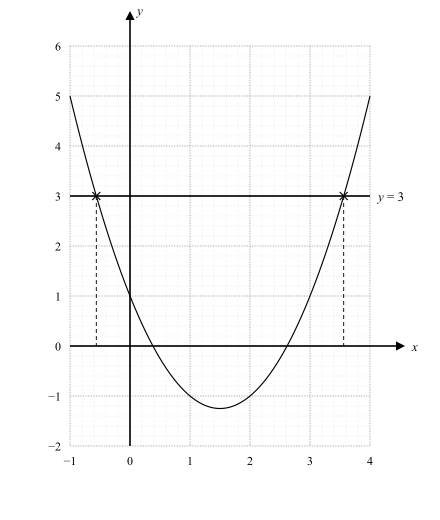
- Where it is set equal to a number, draw that horizontal line and read across
- Where two curves are given, the meeting points solve them simultaneously, and there the y values are wanted too
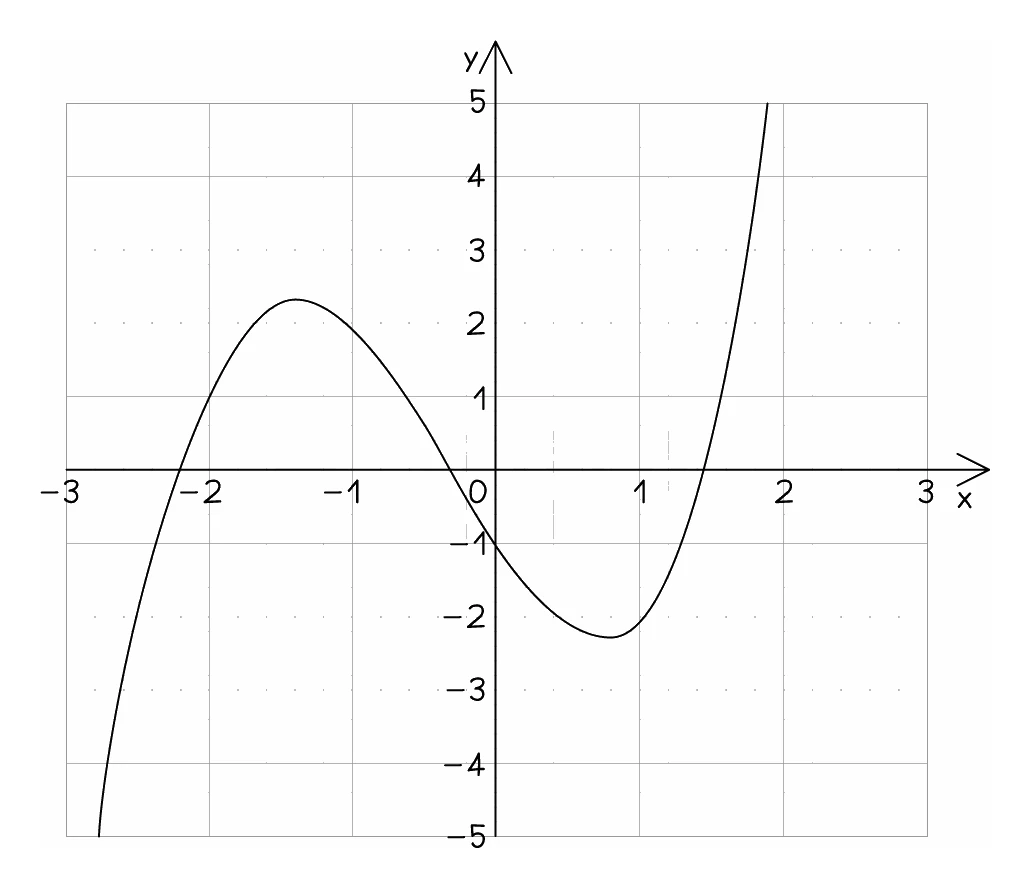
- Read to within half of the smallest square, the accuracy the syllabus sets, and give the x values only, unless the question asks to solve simultaneously
When the equation is not the one plotted
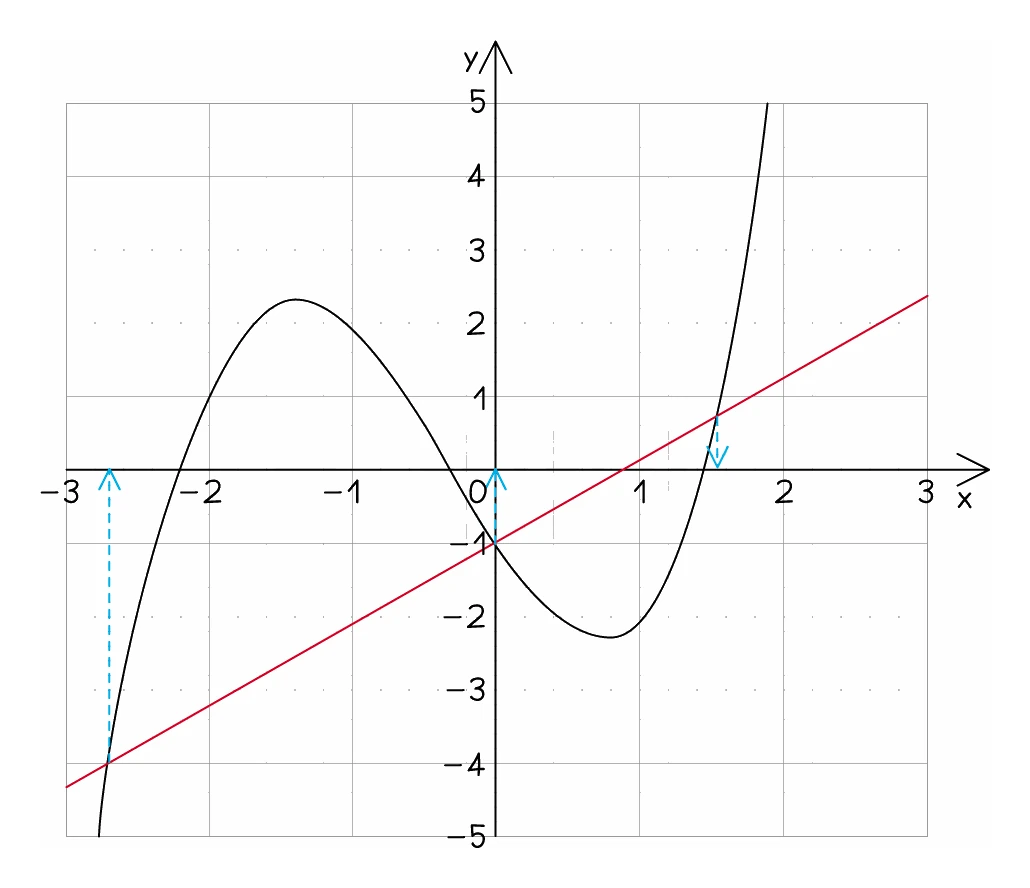
- A question often asks you to solve an equation that is not the one drawn
- Rearrange the new equation until one side is exactly the expression that was plotted
- Whatever is left on the other side is the line you must draw on the grid
- Then read off the x values where that line cuts the curve
Exam tip
Write down the line before you draw it
When you are told to solve an equation by drawing a line on the graph, the line itself earns marks. Write its equation in your working, because that alone often earns one, then rule it right across the grid so it meets the curve at every solution. The answers depend on that line: correct values read off with no correct line drawn usually earn just one special-case mark.
Worked example
Choosing the line to draw
The graph of y = x² − 3x + 1 is drawn on a grid. Explain how to use it to solve x² − 3x − 2 = 0.
Solution:
- The plotted expression is x² − 3x + 1, so make that appear on one side of the new equation
- Start from x² − 3x − 2 = 0
- Add 3 to both sides: x² − 3x + 1 = 3
- The left side is now exactly the plotted curve
- The line to add to the grid is therefore y = 3
- The solutions are the x values where that line meets the curve
5. Estimating a gradient with a tangent
Drawing the tangent
- The gradient of a curve changes from point to point, and the gradient at one point is the gradient of the tangent there
- A tangent is a straight line that touches the curve at that point without cutting across it
- Rest a ruler against the curve at that point and extend the line right across the grid, so the triangle you read from is large
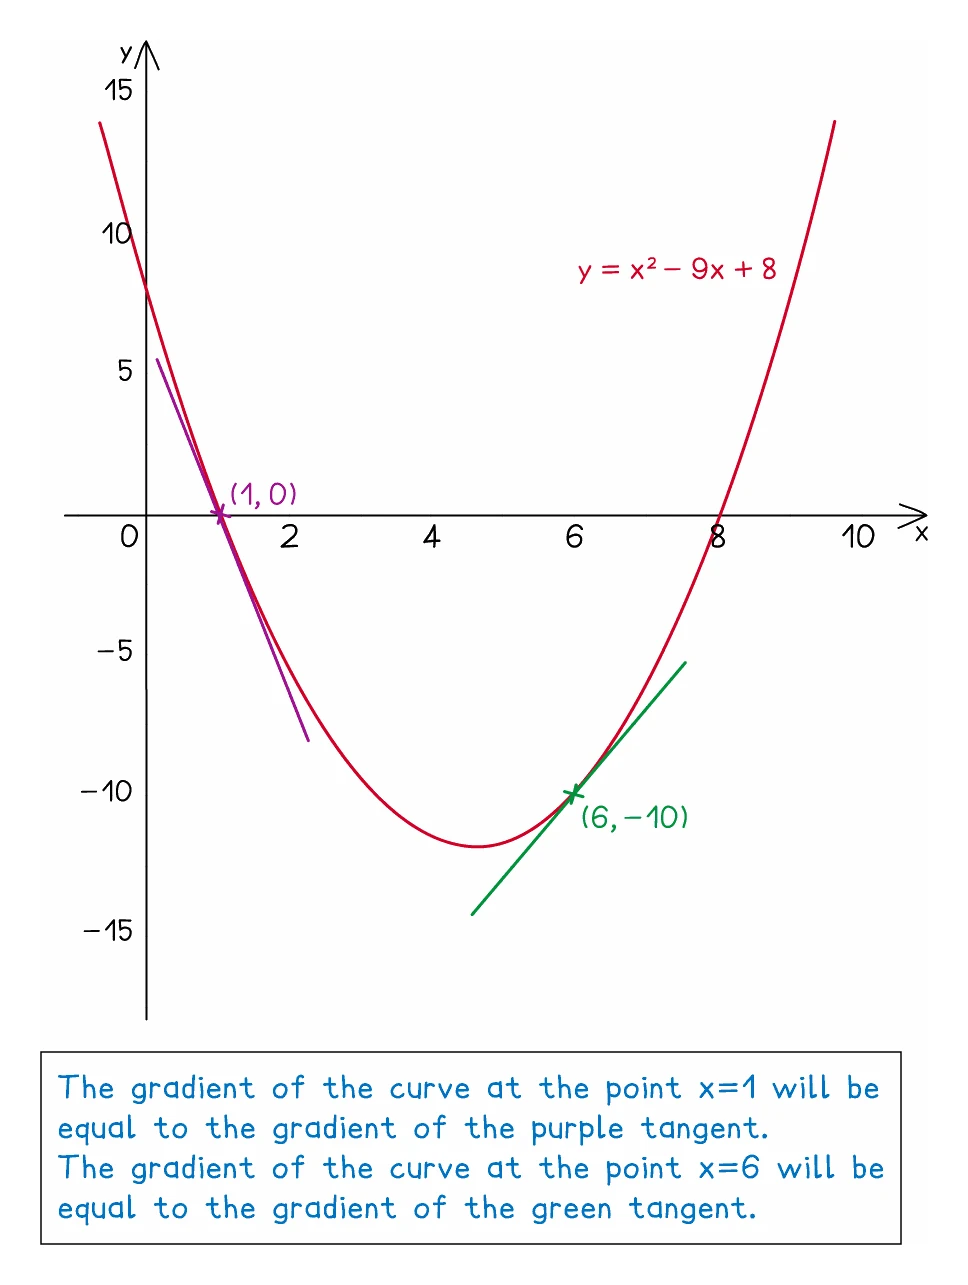
- Read two points far apart on the tangent, ideally on grid intersections, and find the vertical change divided by the horizontal change
- A tangent passing through (1, 2) and (5, 14) has gradient 12 ÷ 4 = 3
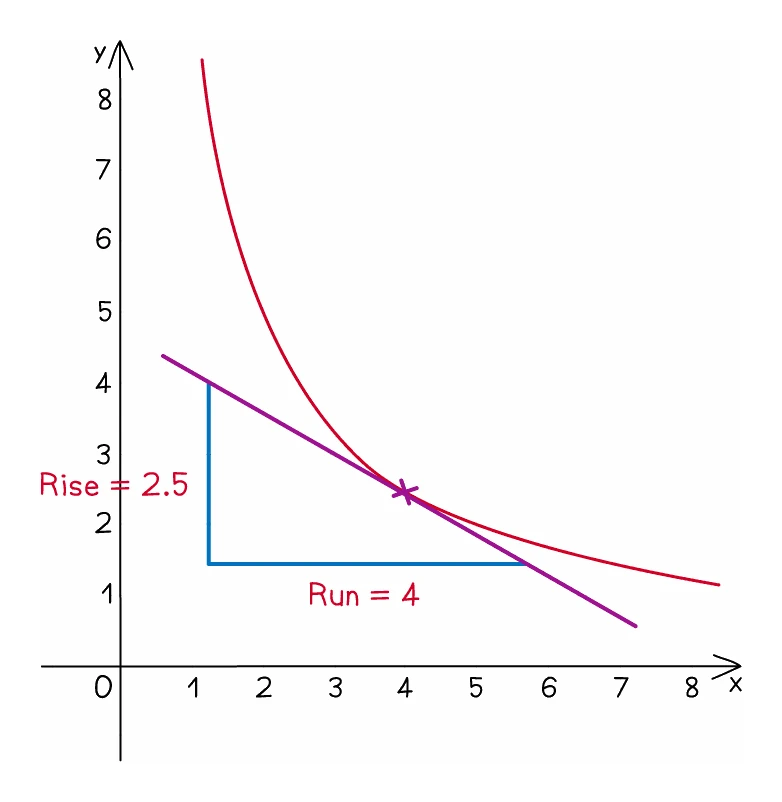
- Going downhill gives a negative gradient, so put the sign in yourself
- The answer is only an estimate, because the tangent is positioned by eye
What the gradient means
- The gradient is the rate at which the vertical quantity changes as the horizontal one increases by 1
- Its units are the units on the vertical axis divided by the units on the horizontal axis
- On a distance–time graph that rate is the speed, and on a speed–time graph it is the acceleration
- Answering "what does the gradient represent" needs the quantity named, with its units, not just a number
Exam tip
Leave a ruled tangent on the graph
The tangent itself earns a mark, so rule it on the printed graph, touching the curve at the required point without cutting across it. When the question asks for the gradient of the curve at that point, such as an acceleration, the estimate is credited only alongside a correct tangent or a close attempt at one, so a value with no tangent drawn scores nothing.
Worked example
Reading a tangent off the grid
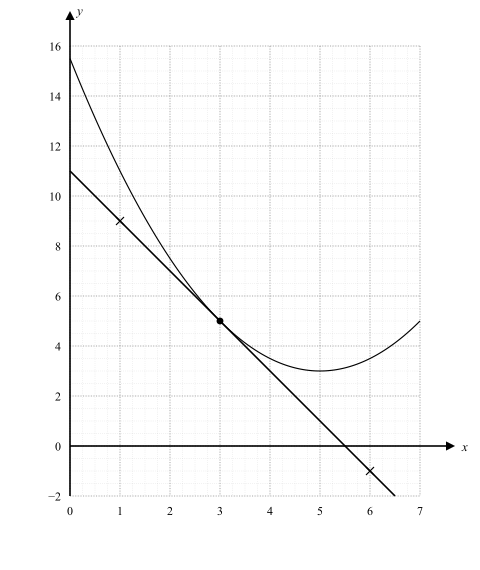
A tangent drawn to a curve at x = 3 passes through the grid points (1, 9) and (6, −1). Estimate the gradient of the curve at x = 3.
Solution:
- Vertical change from the first point to the second: −1 − 9 = −10
- Horizontal change over the same span: 6 − 1 = 5
- Divide the two: −10 ÷ 5 = −2
- The gradient of the tangent is −2, and the curve has the same gradient where the tangent touches it
- So the gradient of the curve at x = 3 is approximately −2
- The tangent slopes downhill, which agrees with the negative answer