1. The probability scale and its vocabulary
Measuring likelihood
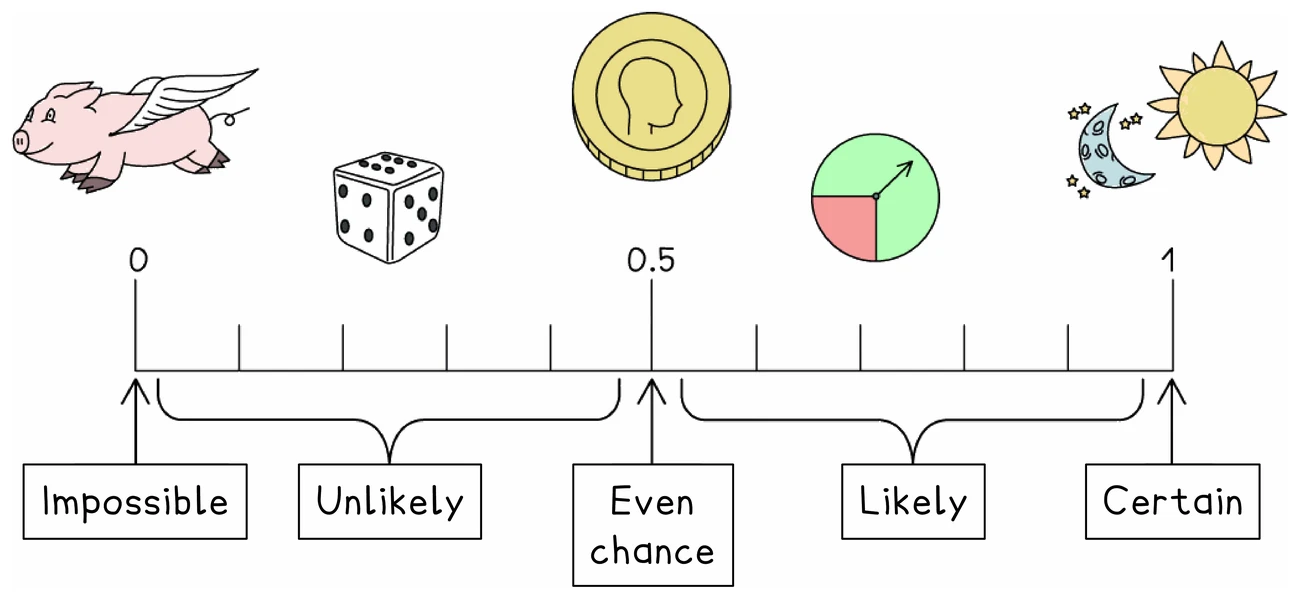
- Every probability is a number from 0 to 1, where 0 means impossible and 1 means certain
- Halfway, at 0.5, the outcome is as likely to happen as not
- Answers may be given as a fraction, a decimal or a percentage, and all three are accepted, but a ratio such as 7 : 20 or words such as "7 out of 20" can lose the mark
- Where the question does not specify, a fraction is usually safest, since it stays exact
- A probability outside 0 to 1 is always an error, so check any answer above 1 or below 0
The words that carry meaning
- An experiment is repeated to produce results, and each repeat is a trial
- An outcome is one possible result; an event may be a single outcome or several of them taken together
- The sample space collects every possible outcome, and is usually set out either as a list or in a table
- Something is fair when every outcome is equally likely, and biased when they are not
- Picking at random means every item has the same chance of being chosen
Notation
- The probability of event A is written P(A), and the probability of A not happening is P(A′)
- n(A) counts the outcomes in event A, matching the set notation used with Venn diagrams
2. Calculating a probability
Equally likely outcomes
- With equally likely outcomes, count how many produce the event and divide that count by how many outcomes there are altogether
- Count the total carefully, since it is the denominator of everything that follows
- A bag holds 40 counters of which 14 are red, so the probability of drawing a red one is 14 ÷ 40, which simplifies to 7/20
- Simplifying is not required unless the question asks for the simplest form: the mark schemes accept any equivalent fraction, such as 14/40
- Information may come from a table, a graph or a Venn diagram rather than from a sentence
Probabilities that must add to 1
- Every outcome of an experiment together accounts for the whole of the probability, so they add to 1
- A table with one probability missing is completed by subtracting the others from 1
- The event not happening takes up whatever is left, so P(not A) = 1 − P(A)
- Where a train has a 0.28 chance of being late, the chance of it not being late is 1 − 0.28 = 0.72
- Events that can never occur together are mutually exclusive, and for those the chance of one or the other is simply the sum of the two
- An event and its complement are always mutually exclusive, which is why they add to 1
Worked example
Completing a probability table
A bag holds beads that are red, blue, green or yellow. A bead is taken at random. The table shows the probabilities of red, blue and green. Find the probability of yellow, and the probability of taking a green or a yellow bead.
| Colour | red | blue | green | yellow |
|---|---|---|---|---|
| Probability | 0.35 | 0.2 | 0.15 |
Solution:
- The four probabilities together must come to 1
- The three given ones total 0.35 + 0.2 + 0.15 = 0.7
- So the probability of yellow is 1 − 0.7 = 0.3
- One bead cannot be both green and yellow, so those events are mutually exclusive and their probabilities add
- P(green or yellow) = 0.15 + 0.3 = 0.45
3. Listing the outcomes
Sample space diagrams
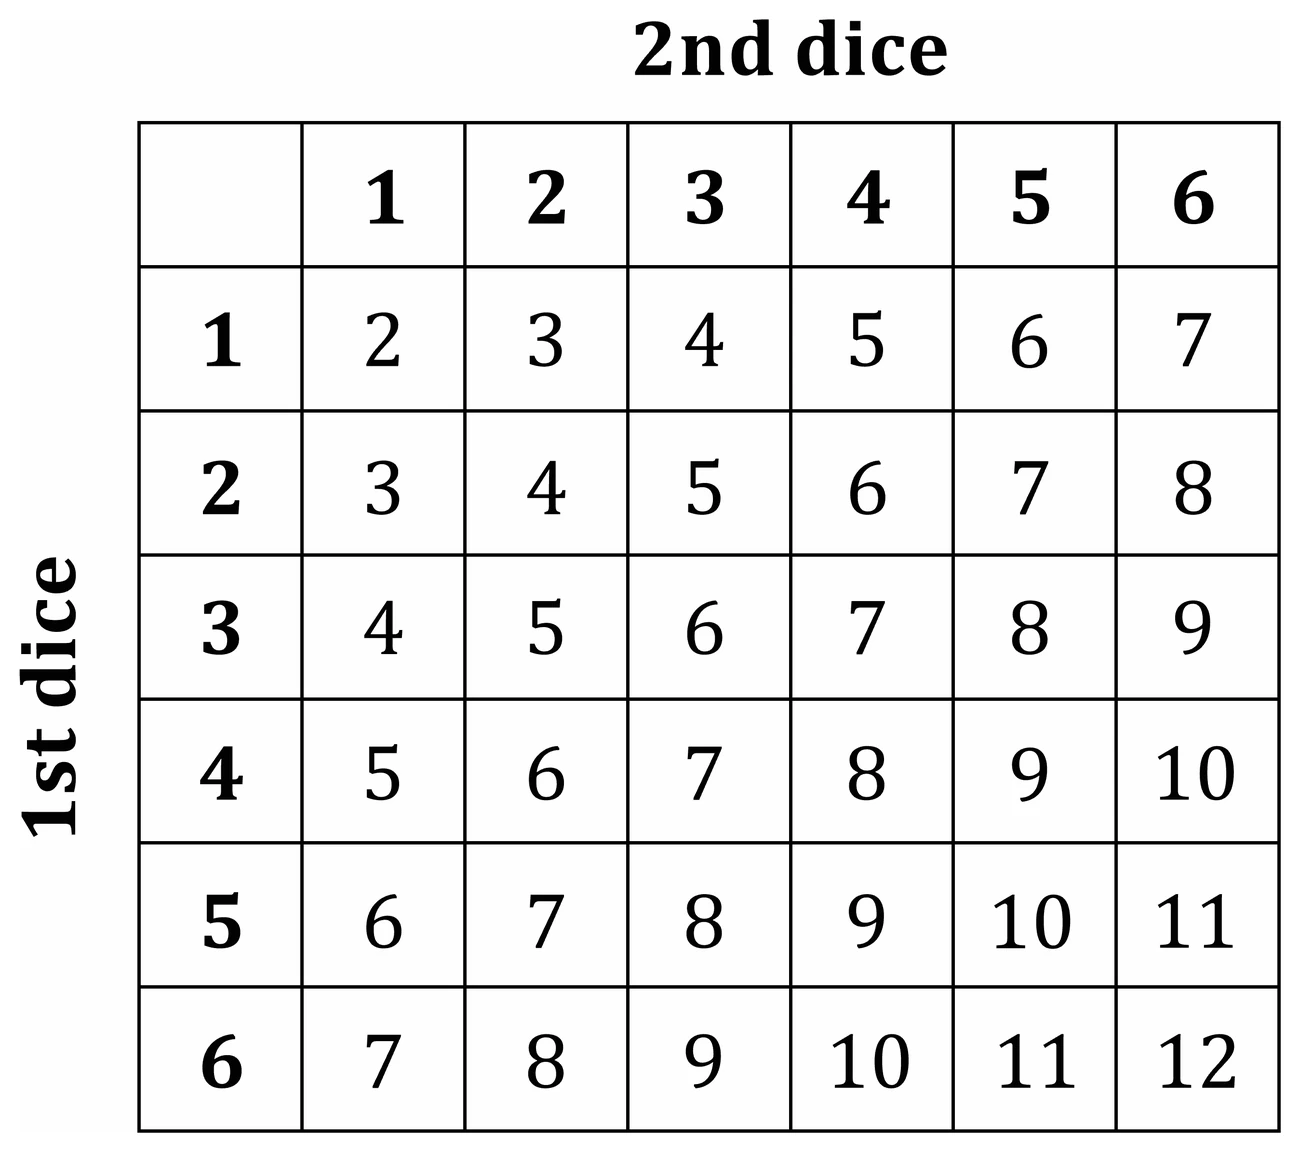
- Where two things happen together, such as two dice or a dice and a coin, a table lays out every combination
- Put one experiment's outcomes along the top and the other's down the side, then fill in the result of each pair
- The number of cells is the total number of outcomes, and counting the ones that satisfy the event gives the numerator
- Two ordinary dice give 6 × 6 = 36 outcomes, and a systematic table makes them impossible to miscount
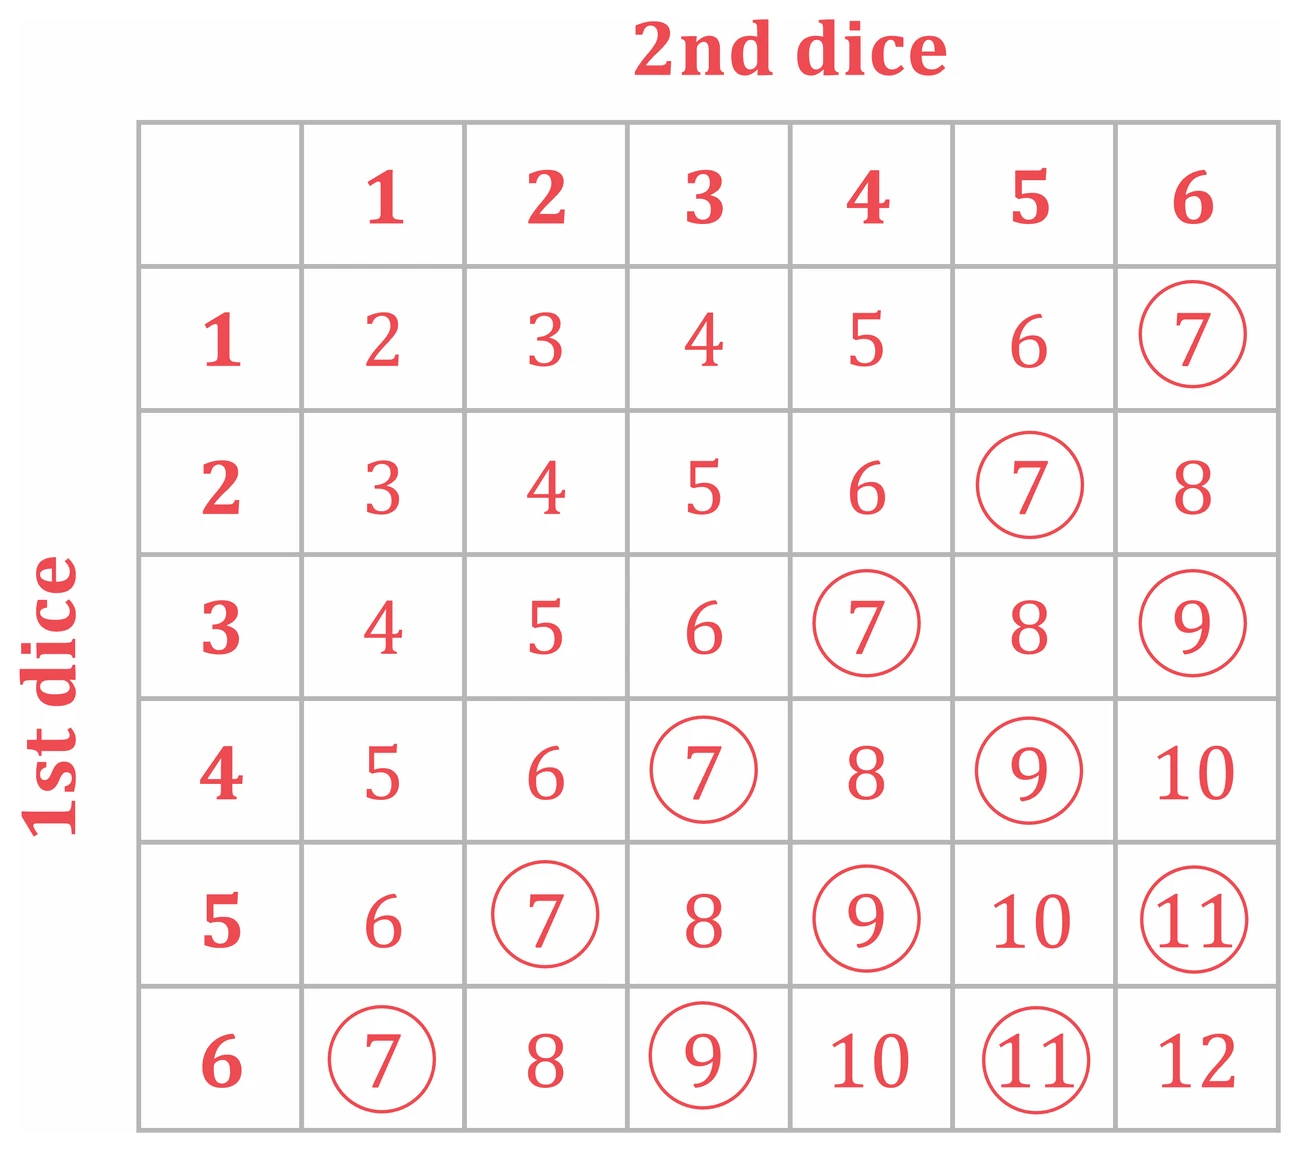
- A total of 9 arises from (3, 6), (4, 5), (5, 4) and (6, 3), so its probability is 4 ÷ 36 = 1/9
- Even if the dice look identical, they are two separate dice, so (3, 6) and (6, 3) are different outcomes and both are counted
- Filling the whole table before counting is faster than trying to spot the successes directly
Worked example
Reading a probability off a sample space
Two ordinary dice are rolled and their scores added. Find the probability that the total is 10 or more.
Solution:
- Each die has 6 faces, so the sample space has 6 × 6 = 36 equally likely outcomes
- List the pairs giving a total of 10 or more, taking them in order so none is missed
- Total 10: (4, 6), (5, 5), (6, 4)
- Total 11: (5, 6), (6, 5)
- Total 12: (6, 6)
- That is 6 successful outcomes out of 36
- P(total ⩾ 10) = 6/36 = 1/6
- Even if the dice look identical, they are two separate dice, so (4, 6) and (6, 4) are two different outcomes, not one
4. Relative and expected frequency
Relative frequency
- Some probabilities cannot be worked out in advance, so they are estimated from an experiment instead
- Relative frequency = number of successes ÷ total number of trials
- It is only an estimate, and the more trials are run the closer it should get to the true probability
- Comparing a relative frequency with the theoretical probability is how a spinner or dice is judged fair or biased
- A fair six-sided dice should give a five about 1/6 of the time, roughly 0.167
- Rolling 300 times and getting 48 fives gives a relative frequency of 48 ÷ 300 = 0.16, close enough to suggest the dice is fair
- A relative frequency far from the theoretical value suggests bias
Expected frequency
- Going the other way, a known probability predicts how often something should happen in a given number of trials
- Expected frequency = probability × number of trials
- The answer is a prediction rather than a guarantee, so the actual number will usually differ a little
- A non-whole answer is acceptable, since an expected frequency is an average rather than a count
- With a probability of 0.15 over 400 trials, the expected frequency is 0.15 × 400 = 60
Exam tip
Use your own probability for the expected number
When a question asks for a probability and then for the expected number of times in so many trials, answer the second part even if you doubt the first. The schemes give that mark for your own probability multiplied by the number of trials. So multiply exactly what you wrote, but check it first: some schemes follow it through only when it lies between 0 and 1, so a value above 1 means a slip to find.
Worked example
Relative frequency and expected frequency together
A spinner has five equal sections numbered 1 to 5. In an experiment it is spun 200 times and lands on 4 on 32 occasions. Find the relative frequency of landing on 4, say whether the spinner appears to be fair, and find the expected number of 4s in 500 spins of a fair spinner.
Solution:
- Relative frequency = 32 ÷ 200 = 0.16
- For a fair five-section spinner the theoretical probability is 1 ÷ 5 = 0.2
- 0.16 is reasonably close to 0.2, so on this evidence the spinner appears roughly fair, though more trials would give a better test
- For a fair spinner, expected frequency = probability × number of trials
- Expected number of 4s = 0.2 × 500 = 100
- Had the question asked how many 4s to expect in 500 spins of this spinner, rather than a fair one, the relative frequency would be the probability to use: 0.16 × 500 = 80